QUESTION IMAGE
Question
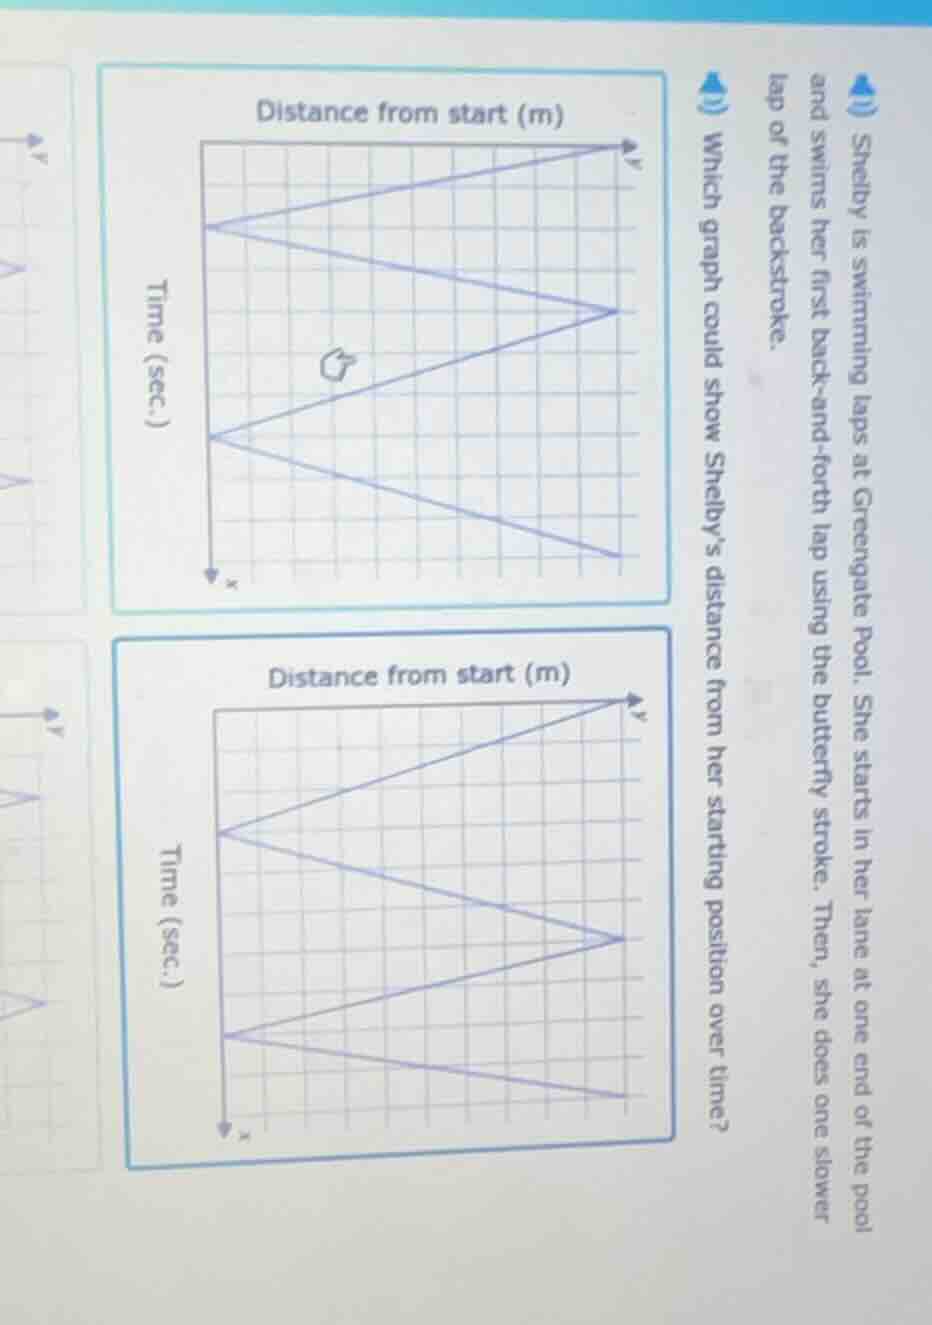
shelby is swimming laps at greengate pool. she starts in her lane at one end of the pool and swims her first back-and-forth lap using the butterfly stroke. then, she does one slower lap of the backstroke. which graph could show shelby’s distance from her starting position over time? two graphs are shown, both with distance from start (m) on the y - axis and time (sec.) on the x - axis, with grid lines and blue line graphs inside each.
Brief Explanations
- Shelby starts at position 0 (distance from start = 0).
- First, she swims butterfly (fast) to the other end: distance increases quickly (steep upward slope).
- She swims back butterfly (fast) to start: distance decreases quickly (steep downward slope, returns to 0).
- Then she swims one slow backstroke lap: distance increases slowly (gentle upward slope) to the end, then decreases slowly (gentle downward slope) back to start.
- Compare to the graphs:
- Top graph: First two slopes (fast lap) are steeper than the last two slopes (slow lap), which matches.
- Bottom graph: First two slopes are gentler than the last two, which is the opposite of the scenario.

Snap & solve any problem in the app
Get step-by-step solutions on Sovi AI
Photo-based solutions with guided steps
Explore more problems and detailed explanations
The top graph (upper Distance from start vs Time graph)