QUESTION IMAGE
Question
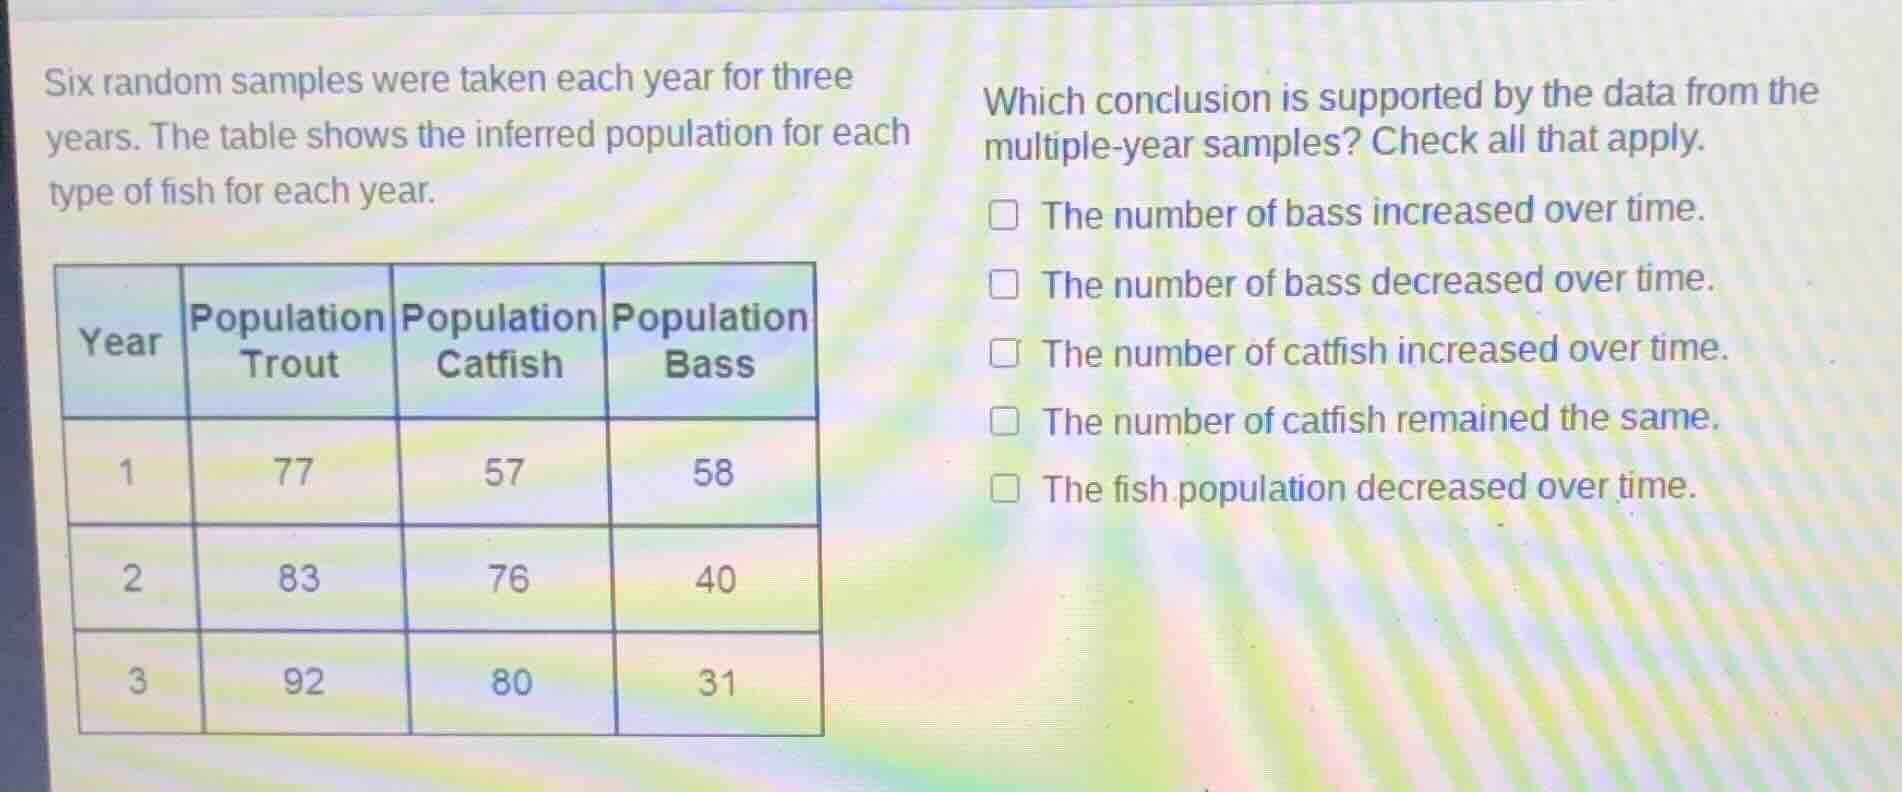
six random samples were taken each year for three years. the table shows the inferred population for each type of fish for each year.
which conclusion is supported by the data from the multiple - year samples? check all that apply.
the number of bass increased over time.
the number of bass decreased over time.
the number of catfish increased over time.
the number of catfish remained the same.
the fish population decreased over time.
Brief Explanations
- Analyze bass population: 58 (Year1) → 40 (Year2) → 31 (Year3): it decreases over time.
- Analyze catfish population: 57 (Year1) → 76 (Year2) → 80 (Year3): it increases over time.
- Analyze total fish population:
Year1: $77+57+58=192$
Year2: $83+76+40=199$
Year3: $92+80+31=203$: total increases over time.
- Match these observations to the given conclusions.

Snap & solve any problem in the app
Get step-by-step solutions on Sovi AI
Photo-based solutions with guided steps
Explore more problems and detailed explanations
- The number of bass decreased over time.
- The number of catfish increased over time.