QUESTION IMAGE
Question
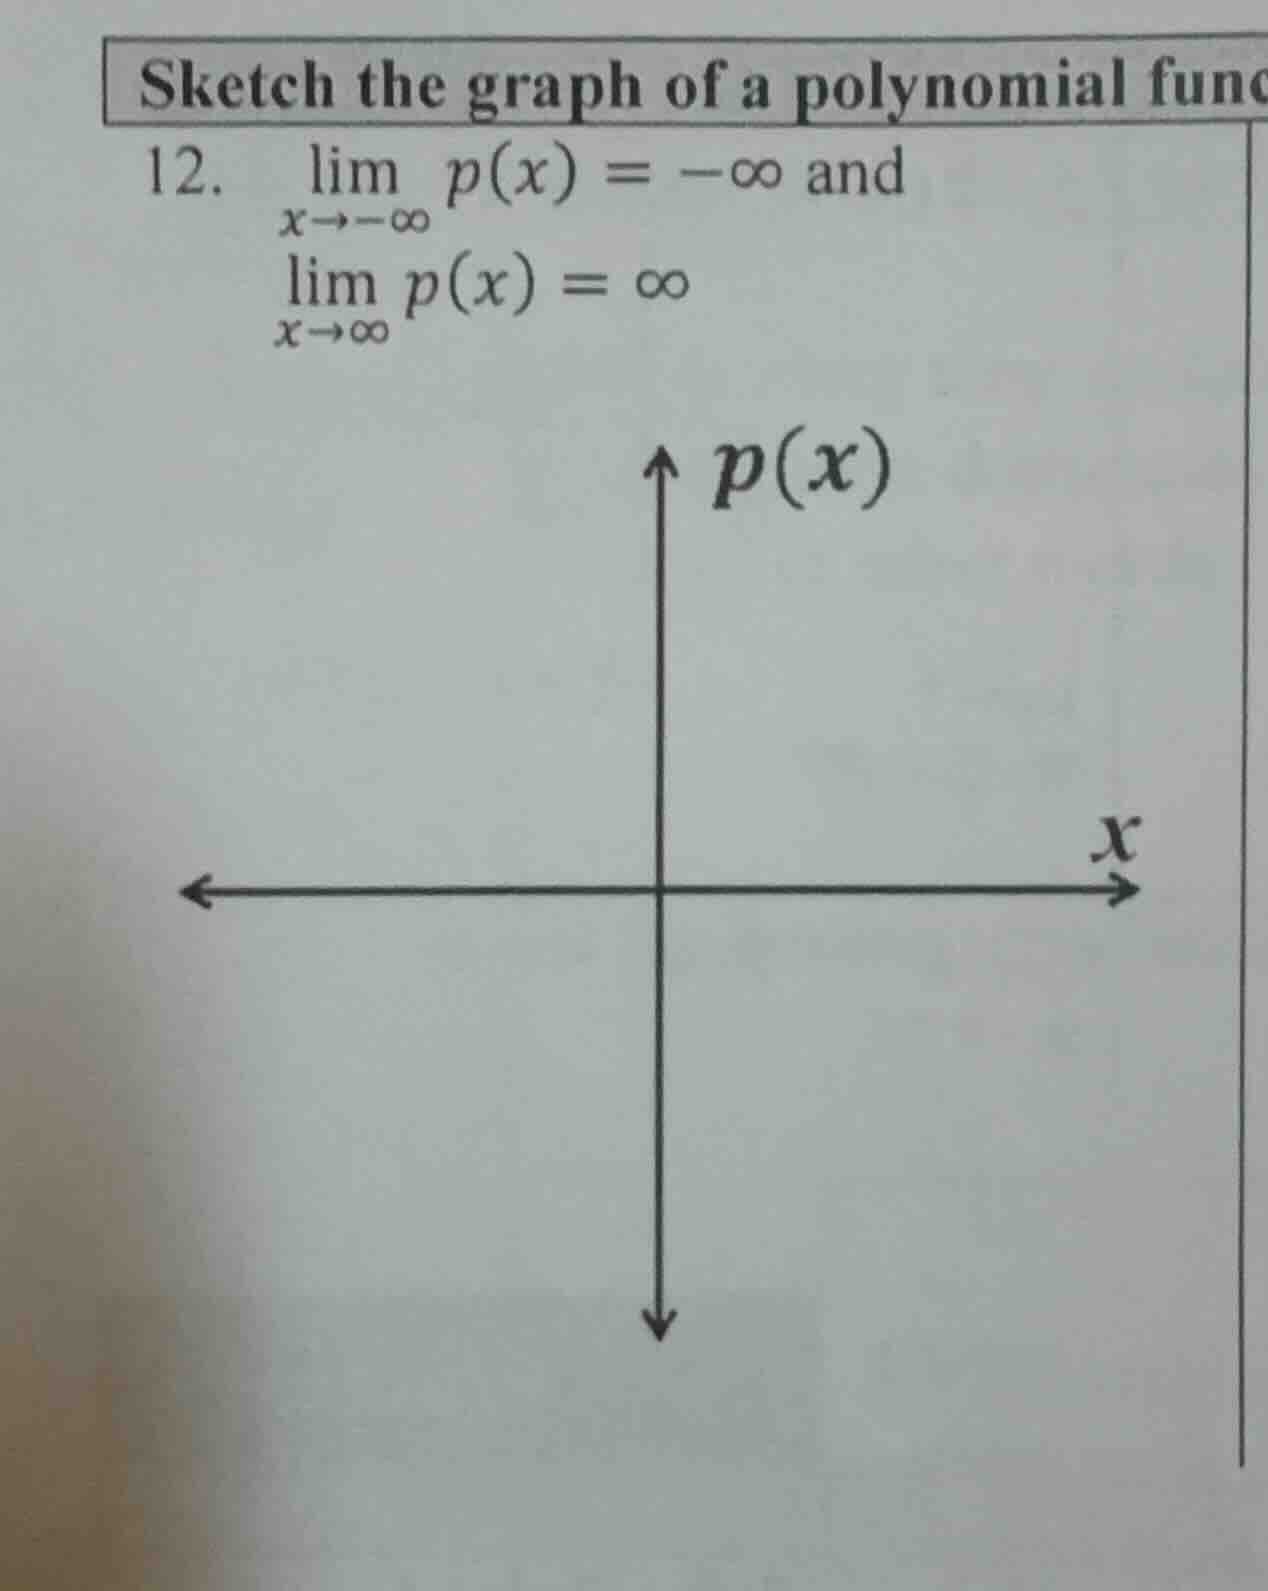
sketch the graph of a polynomial func
- \\(\lim\limits_{x\to -\infty} p(x) = -\infty\\) and\\(\lim\limits_{x\to \infty} p(x) = \infty\\)
Step1: Identify polynomial degree parity
The end behavior $\lim_{x\to-\infty} p(x) = -\infty$ and $\lim_{x\to\infty} p(x) = \infty$ matches polynomials with odd degree and positive leading coefficient. For example, $p(x)=x$ (degree 1) or $p(x)=x^3$ (degree 3).
Step2: Choose simple polynomial example
Select $p(x)=x$, a basic odd-degree polynomial with positive leading coefficient.
Step3: Plot key end behavior
- As $x\to\infty$, $p(x)\to\infty$ (graph rises right).
- As $x\to-\infty$, $p(x)\to-\infty$ (graph falls left).
- The line passes through the origin $(0,0)$ and has a constant positive slope.

Snap & solve any problem in the app
Get step-by-step solutions on Sovi AI
Photo-based solutions with guided steps
Explore more problems and detailed explanations
A valid graph is a straight line (or any odd-degree polynomial curve) that rises to the right, falls to the left, and is continuous with no breaks. For the simple case of $p(x)=x$, the graph is a diagonal line passing through the origin, extending upward infinitely as $x\to\infty$ and downward infinitely as $x\to-\infty$.