QUESTION IMAGE
Question
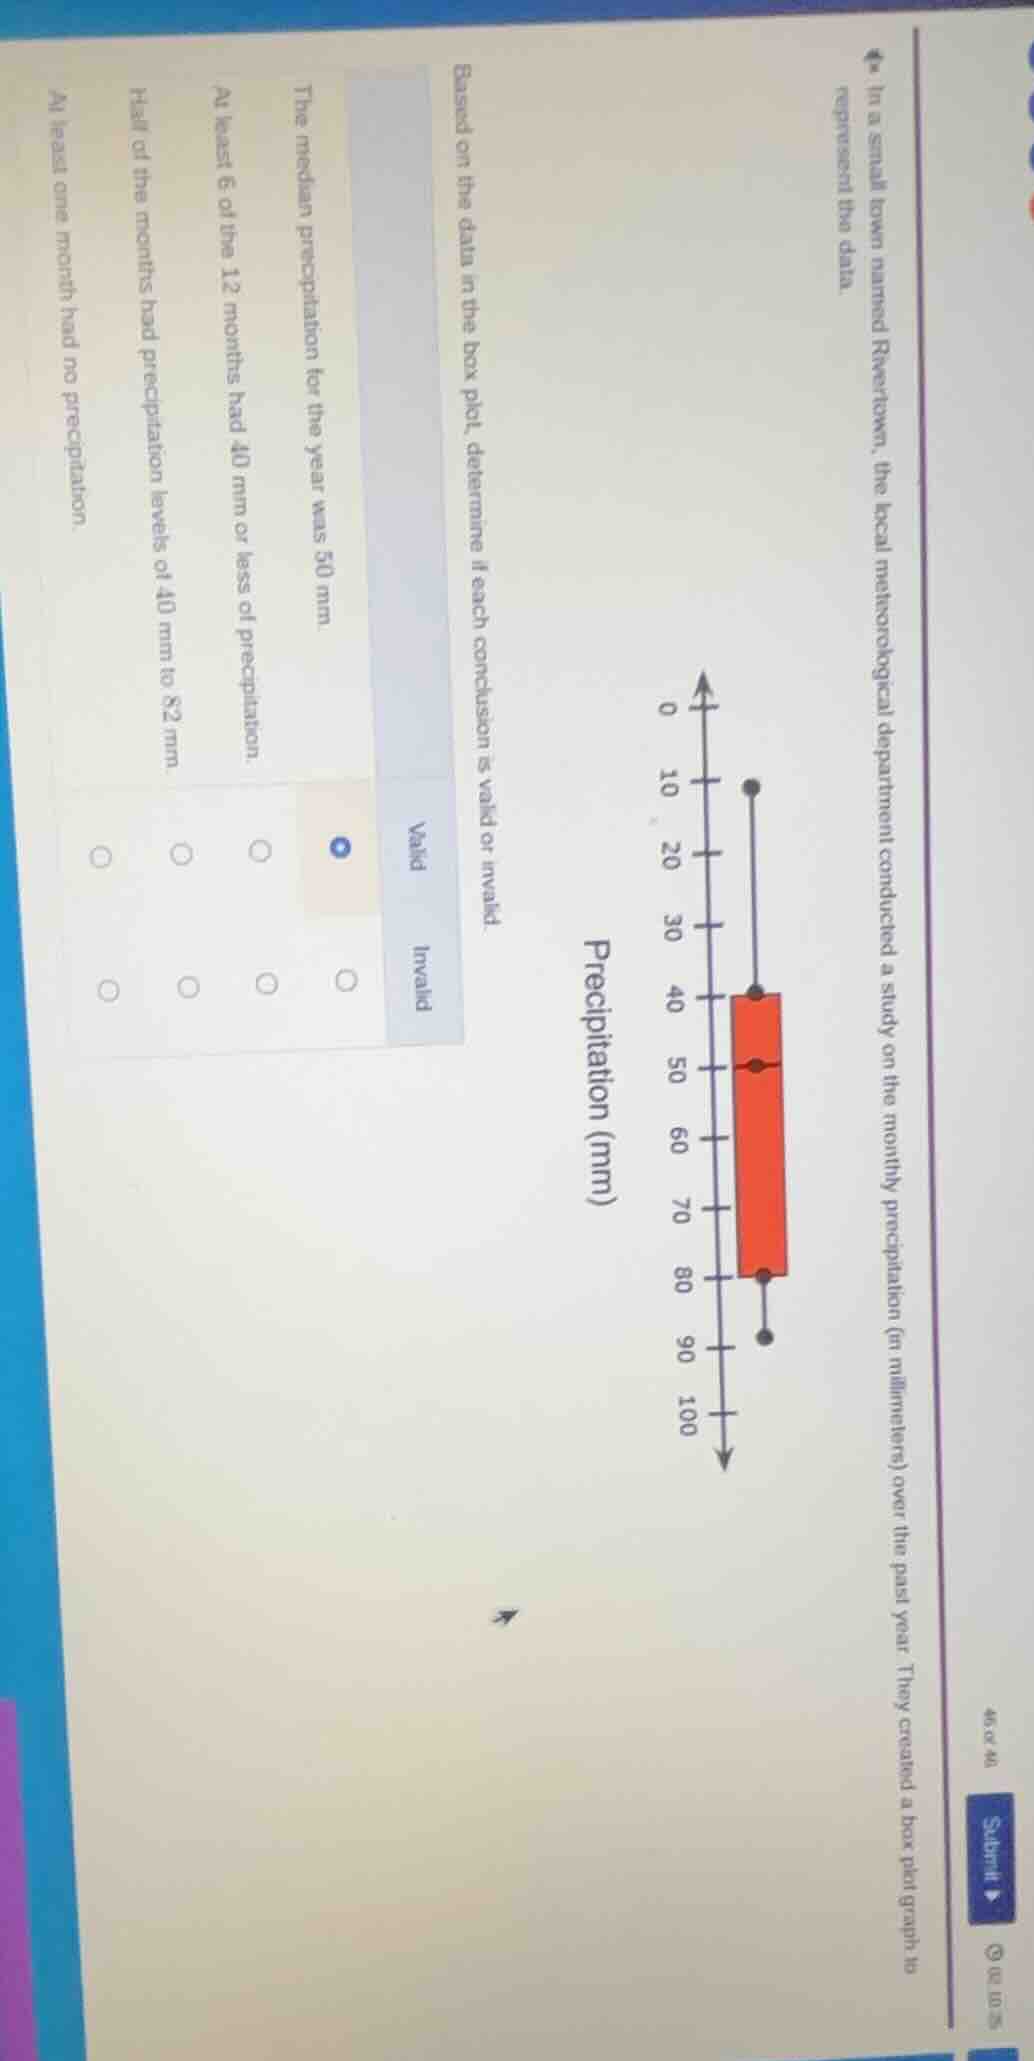
in a small town named rivertown, the local meteorological department conducted a study on the monthly precipitation (in millimeters) over the past year. they created a box plot graph to represent the data.
based on the data in the box plot, determine if each conclusion is valid or invalid.
valid invalid
the median precipitation for the year was 50 mm.
at least 6 of the 12 months had 40 mm or less of precipitation.
half of the months had precipitation levels of 40 mm to 82 mm.
at least one month had no precipitation.
For "The median precipitation for the year was 50 mm"
In a box - plot, the line inside the box represents the median. From the given box - plot, we can see that this line is at 50 mm. So, this conclusion is valid.
In a box - plot, the left side of the box (the lower quartile) divides the data such that 25% of the data is below it. The lower quartile here is at 40 mm. Since there are 12 months (a year), 25% of 12 is 3, not 6. So, at most 3 months had 40 mm or less of precipitation. This conclusion is invalid.
In a box - plot, the box represents the middle 50% of the data (from the lower quartile to the upper quartile). The lower quartile is 40 mm and the upper quartile is 82 mm. Since the middle 50% of 12 months is 6 months, half (6) of the months had precipitation levels between 40 mm and 82 mm. This conclusion is valid.

Snap & solve any problem in the app
Get step-by-step solutions on Sovi AI
Photo-based solutions with guided steps
Explore more problems and detailed explanations
Valid