QUESTION IMAGE
Question
solutions to real - world inequality problems practice
complete this assessment to review what youve learned. it will not count toward your grade.
use the image to answer the question.
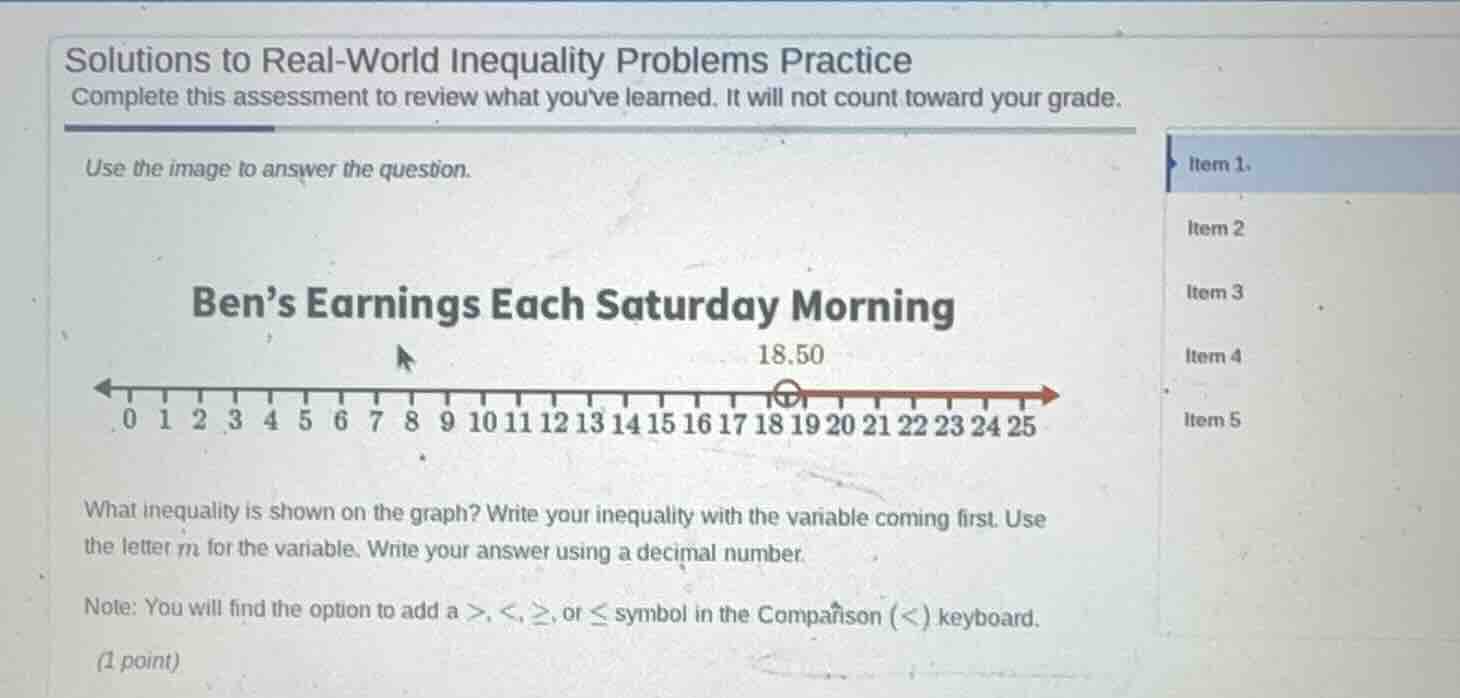
ben’s earnings each saturday morning
number line from 0 to 25, with an open circle at 18.50 and a red arrow pointing to the right
what inequality is shown on the graph? write your inequality with the variable coming first. use the letter m for the variable. write your answer using a decimal number.
note: you will find the option to add a >, <, ≥, or ≤ symbol in the comparison (<) keyboard.
(1 point)
Step1: Analyze the graph's key features
The graph has an open circle at 18.50, which means the value 18.50 is not included. The arrow points to the right, indicating values greater than 18.50.
Step2: Define the inequality with variable $m$
Using variable $m$ to represent the values, the inequality is $m > 18.50$.

Snap & solve any problem in the app
Get step-by-step solutions on Sovi AI
Photo-based solutions with guided steps
Explore more problems and detailed explanations
$m > 18.50$