QUESTION IMAGE
Question
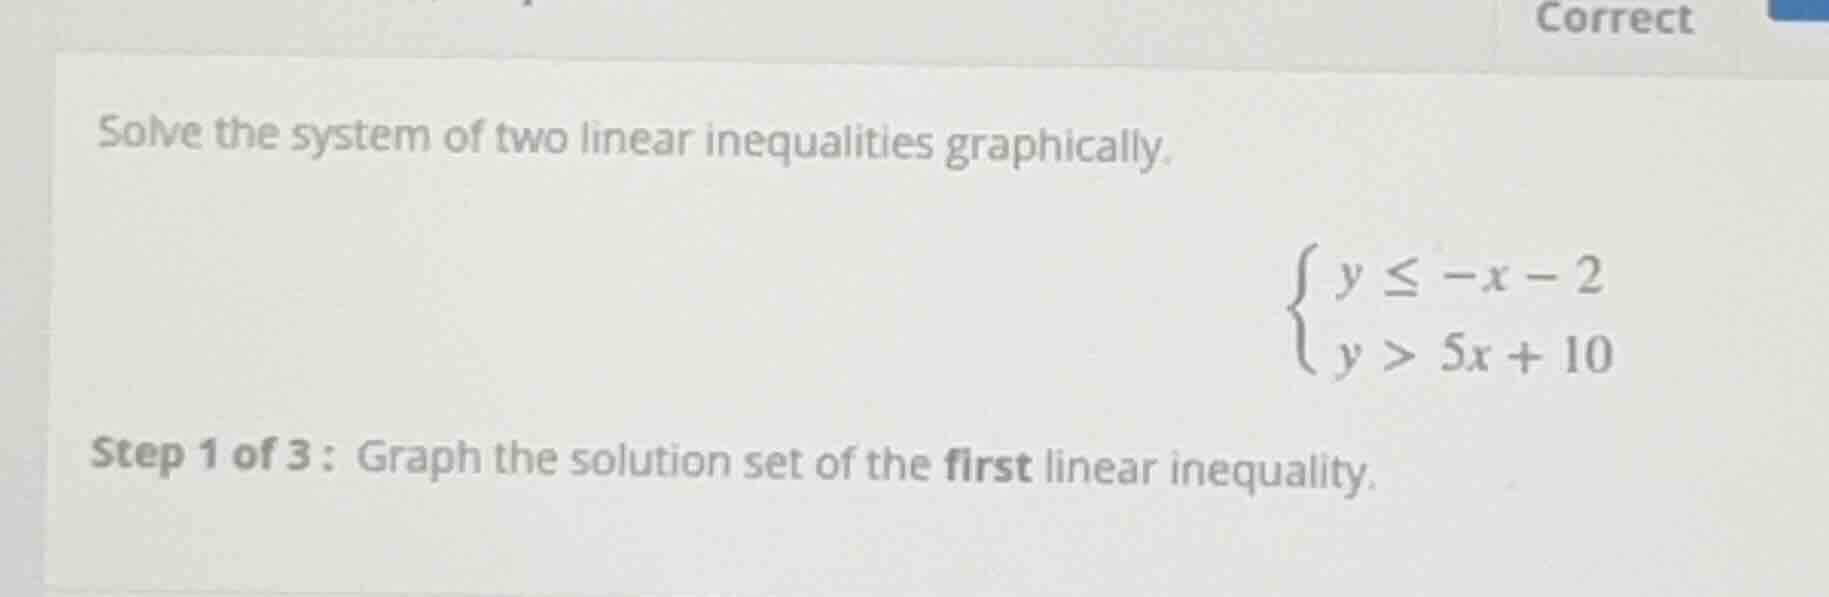
solve the system of two linear inequalities graphically.\
\
step 1 of 3: graph the solution set of the first linear inequality.
Step1: Identify boundary line
The first inequality is $y \leq -x - 2$. Its boundary is the line $y = -x - 2$. Since the inequality uses $\leq$, the line will be solid (to include points on the line).
Step2: Find intercepts for plotting
- x-intercept: Set $y=0$:
$0 = -x - 2 \implies x = -2$. So the point is $(-2, 0)$.
- y-intercept: Set $x=0$:
$y = -0 - 2 = -2$. So the point is $(0, -2)$.
Step3: Determine shading direction
Choose a test point not on the line, e.g., $(0,0)$:
$0 \leq -0 - 2 \implies 0 \leq -2$, which is false. So shade the half-plane below the solid line $y=-x-2$.

Snap & solve any problem in the app
Get step-by-step solutions on Sovi AI
Photo-based solutions with guided steps
Explore more problems and detailed explanations
Graph the solid line $y = -x - 2$ (passing through $(-2, 0)$ and $(0, -2)$), then shade the region below this line.