QUESTION IMAGE
Question
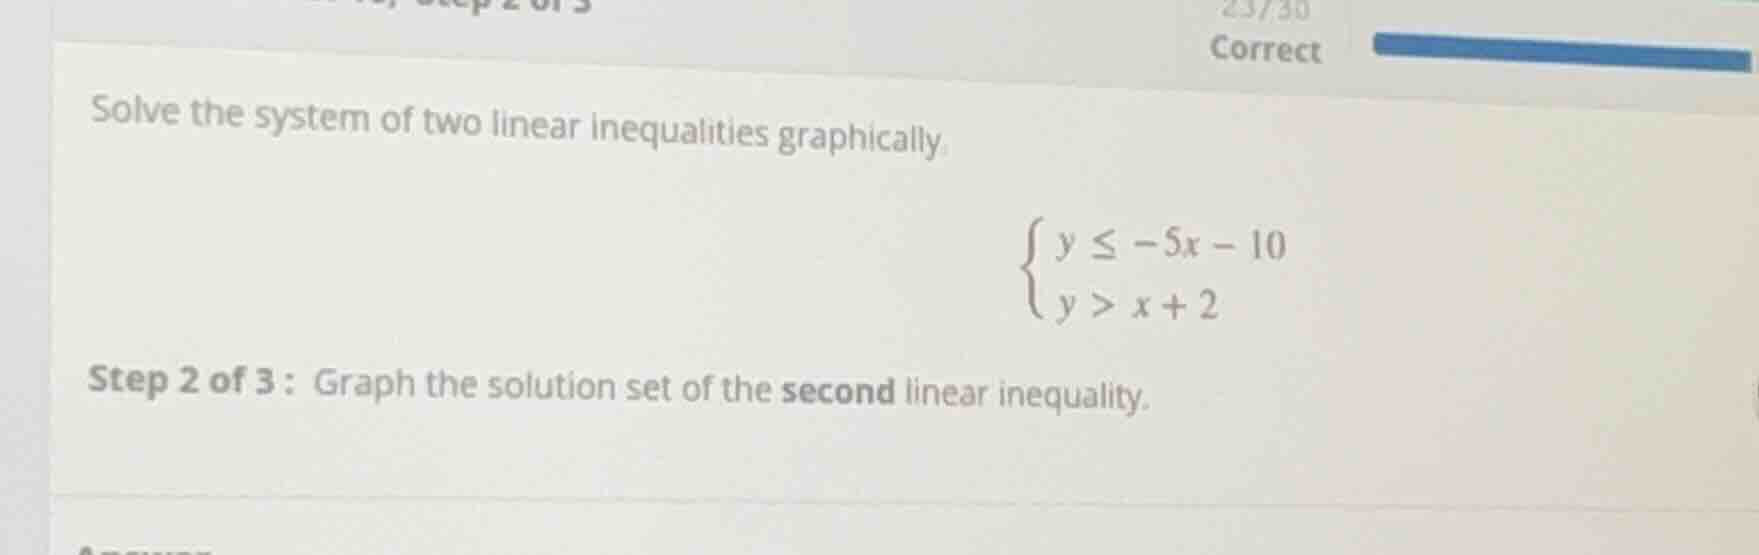
solve the system of two linear inequalities graphically. \\(\
$$\begin{cases} y \\leq -5x - 10 \\\\ y > x + 2 \\end{cases}$$
\\) step 2 of 3: graph the solution set of the second linear inequality.
Step1: Identify boundary line
The boundary of $y > x + 2$ is the line $y = x + 2$. Since the inequality uses $>$, the line will be dashed.
Step2: Find intercepts for the line
For x-intercept: set $y=0$, so $0 = x + 2 \implies x = -2$. The x-intercept is $(-2, 0)$.
For y-intercept: set $x=0$, so $y = 0 + 2 = 2$. The y-intercept is $(0, 2)$.
Step3: Determine shaded region
Test a point not on the line, e.g., $(0,0)$: $0 > 0 + 2$ is false. So shade the region that does NOT contain $(0,0)$ (the area above the dashed line).

Snap & solve any problem in the app
Get step-by-step solutions on Sovi AI
Photo-based solutions with guided steps
Explore more problems and detailed explanations
- Draw a dashed line through points $(-2, 0)$ and $(0, 2)$ (this is $y = x + 2$).
- Shade the region above this dashed line.