QUESTION IMAGE
Question
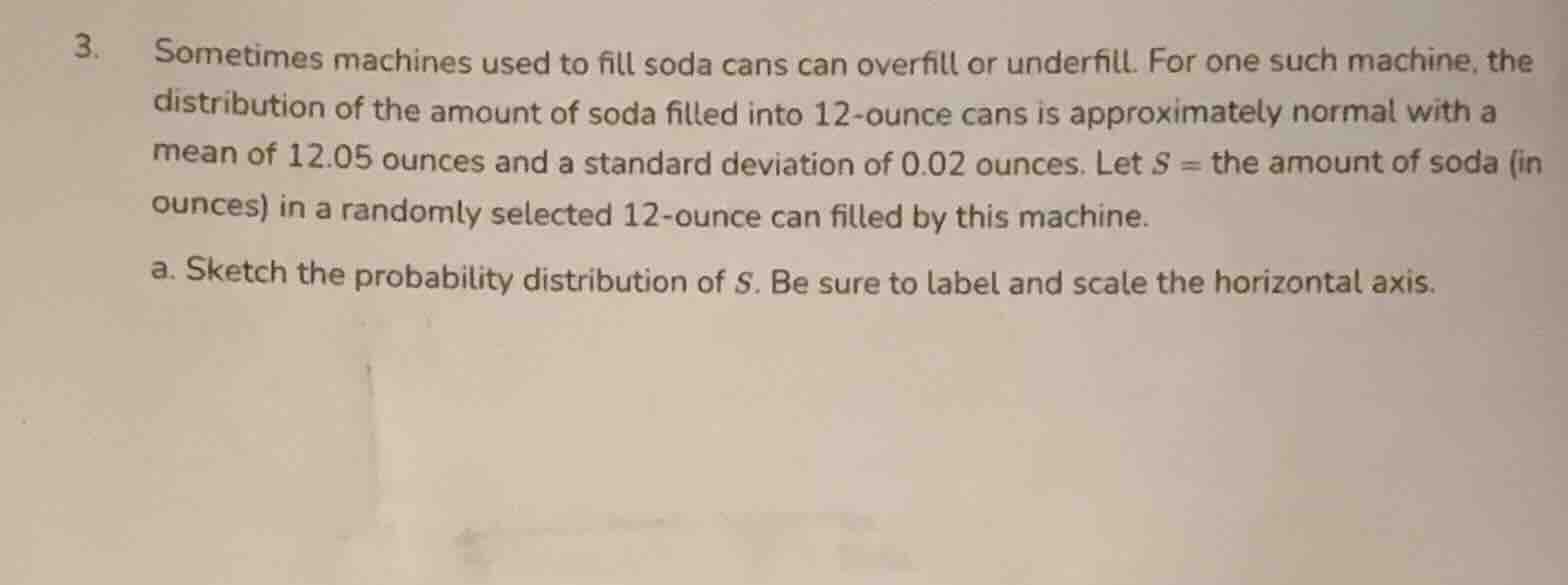
- sometimes machines used to fill soda cans can overfill or underfill. for one such machine, the distribution of the amount of soda filled into 12-ounce cans is approximately normal with a mean of 12.05 ounces and a standard deviation of 0.02 ounces. let s = the amount of soda (in ounces) in a randomly selected 12-ounce can filled by this machine. a. sketch the probability distribution of s. be sure to label and scale the horizontal axis.
Brief Explanations
The distribution is a normal (bell-shaped) curve. The horizontal axis (labeled $S$, amount of soda in ounces) is centered at the mean $\mu=12.05$. We scale the axis using the standard deviation $\sigma=0.02$, marking points 3 standard deviations above and below the mean to cover the typical range of the normal distribution.

Snap & solve any problem in the app
Get step-by-step solutions on Sovi AI
Photo-based solutions with guided steps
Explore more problems and detailed explanations
- Draw a symmetric bell-shaped curve.
- Label the horizontal axis as $S$ (Amount of soda in ounces).
- Mark the center of the axis as $12.05$ (the mean $\mu$).
- Mark the following points on the axis:
- $12.05 - 3(0.02) = 11.99$
- $12.05 - 2(0.02) = 12.01$
- $12.05 - 0.02 = 12.03$
- $12.05 + 0.02 = 12.07$
- $12.05 + 2(0.02) = 12.09$
- $12.05 + 3(0.02) = 12.11$
The bell curve peaks at $12.05$ and tapers symmetrically towards the tails at the outermost marked points.