QUESTION IMAGE
Question
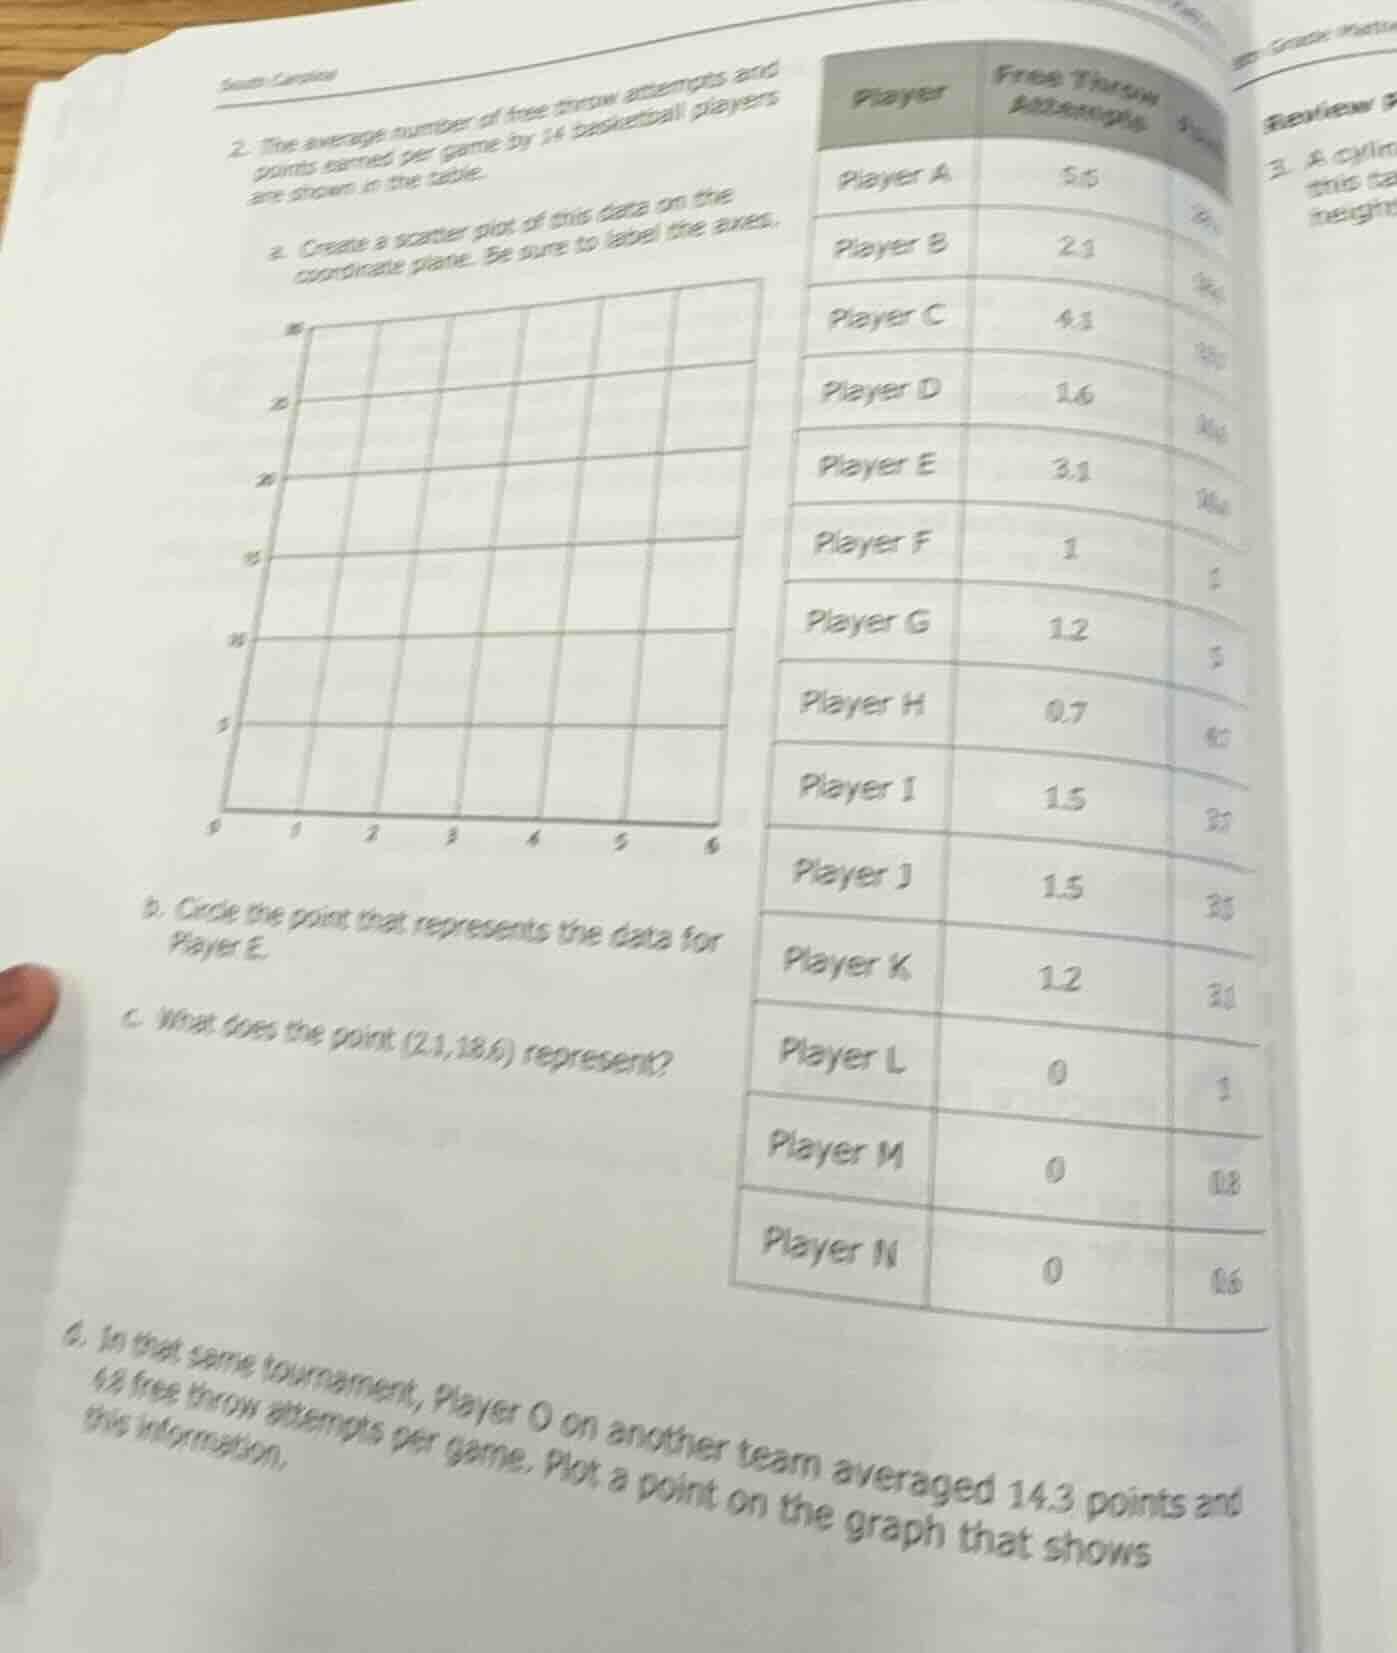
south carolina2. the average number of free throw attempts and points earned per game by 14 basketball players are shown in the table.a. create a scatter plot of this data on the coordinate plane. be sure to label the axes.b. circle the point that represents the data for player e.c. what does the point (2.1,18.6) represent?d. in that same tournament, player o on another team averaged 14.3 points and 4.8 free throw attempts per game. plot a point on the graph that shows this information.|player|free throw attempts|| ---- | ---- ||player a|5.5||player b|2.1||player c|4.1||player d|1.6||player e|3.1||player f|1||player g|1.2||player h|0.7||player i|1.5||player j|1.5||player k|1.2||player l|0||player m|0||player n|0|
Step1: Label scatter plot axes
Label x-axis: Free Throw Attempts (0 to 6), y-axis: Points Earned per Game (0 to 30).
Step2: Plot all player data points
Plot each (Attempts, Points) pair:
- Player A: $(5.5, 26)$
- Player B: $(2.1, 18.6)$
- Player C: $(4.1, 19)$
- Player D: $(1.6, 10.1)$
- Player E: $(3.1, 10.4)$
- Player F: $(1, 9)$
- Player G: $(1.2, 9)$
- Player H: $(0.7, 4.7)$
- Player I: $(1.5, 9.7)$
- Player J: $(1.5, 9.5)$
- Player K: $(1.2, 9.1)$
- Player L: $(0, 1)$
- Player M: $(0, 0.8)$
- Player N: $(0, 0.6)$
Step3: Circle Player E's point
Locate and circle $(3.1, 10.4)$ on the plot.
Step4: Interpret point (2.1,18.6)
Match coordinates to table data for Player B.
Step5: Plot Player O's data
Add the point $(4.8, 14.3)$ to the scatter plot.

Snap & solve any problem in the app
Get step-by-step solutions on Sovi AI
Photo-based solutions with guided steps
Explore more problems and detailed explanations
a. Scatter plot with x-axis labeled "Free Throw Attempts" (0-6) and y-axis labeled "Points Earned per Game" (0-30), with all 14 player data points plotted as listed in Step2.
b. The circled point is $(3.1, 10.4)$ (Player E's data).
c. The point $(2.1, 18.6)$ represents a basketball player (Player B) who averaged 2.1 free throw attempts and 18.6 points per game.
d. The point $(4.8, 14.3)$ is added to the scatter plot to represent Player O's data.