QUESTION IMAGE
Question
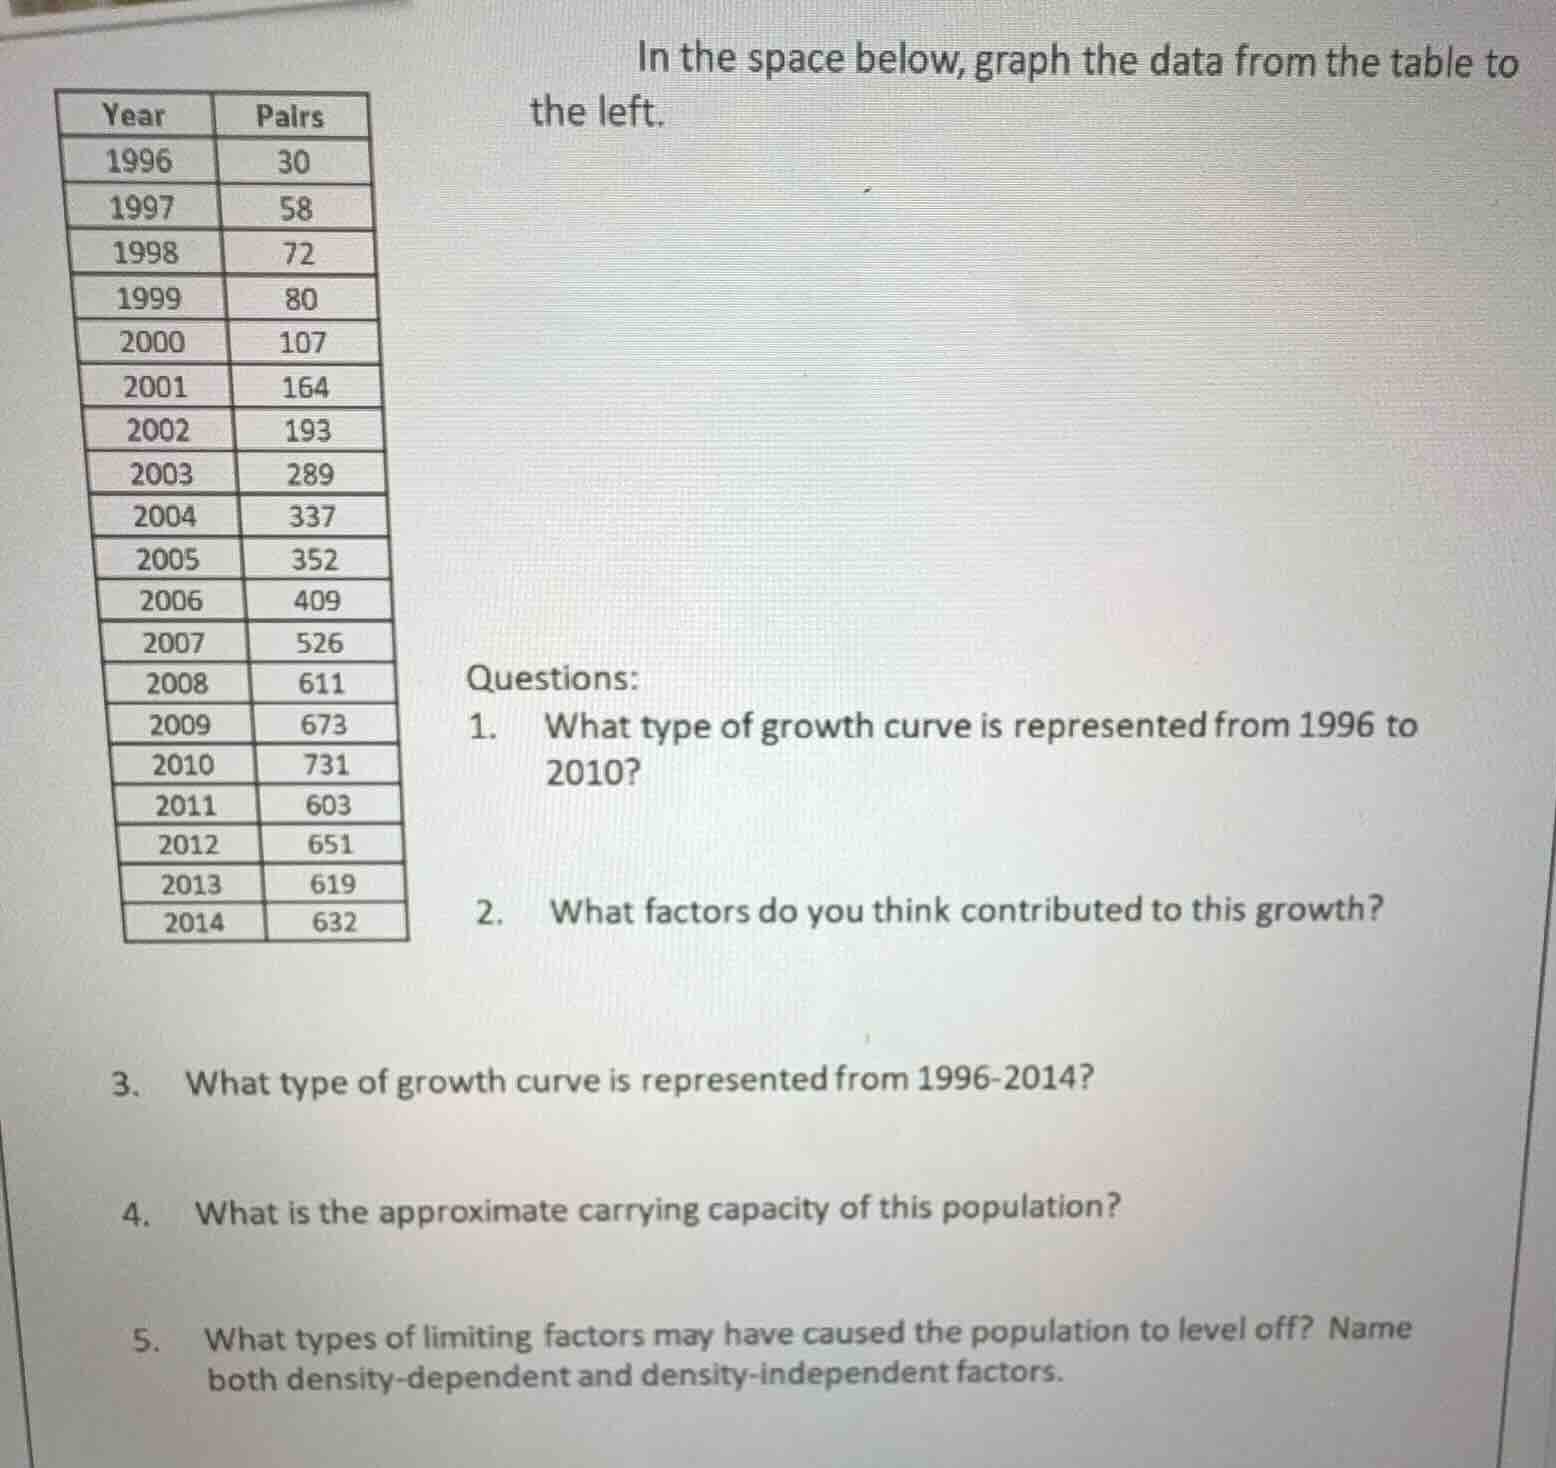
in the space below, graph the data from the table to the left.
| year | pairs |
|---|---|
| 1997 | 58 |
| 1998 | 72 |
| 1999 | 80 |
| 2000 | 107 |
| 2001 | 164 |
| 2002 | 193 |
| 2003 | 289 |
| 2004 | 337 |
| 2005 | 352 |
| 2006 | 409 |
| 2007 | 526 |
| 2008 | 611 |
| 2009 | 673 |
| 2010 | 731 |
| 2011 | 603 |
| 2012 | 651 |
| 2013 | 619 |
| 2014 | 632 |
questions:
- what type of growth curve is represented from 1996 to 2010?
- what factors do you think contributed to this growth?
- what type of growth curve is represented from 1996 - 2014?
- what is the approximate carrying capacity of this population?
- what types of limiting factors may have caused the population to level off? name both density - dependent and density - independent factors.
Question 1
From 1996 to 2010, the number of pairs shows a pattern of increasing rapidly without obvious signs of slowing down due to resource limitations (in the context of this data, if we assume it's a population-like growth). Exponential growth is characterized by a constant percentage increase, and the data from 1996 - 2010 shows a trend where the quantity is increasing at an accelerating rate (e.g., from 30 in 1996 to 731 in 2010, the growth is rapid and not yet showing the leveling off of logistic growth).
Factors contributing to such growth could include an abundance of resources (like food, space, or suitable habitat if it's a biological population), lack of significant predators or competitors, favorable environmental conditions (such as climate, absence of natural disasters), and possibly human intervention like protection or introduction to a new, unexploited area. If it's a non - biological "population" (like a business or technological adoption), factors could be market demand, technological advancements, or effective marketing/development strategies.
From 1996 - 2014, initially (1996 - 2010) there is exponential - like growth, but after 2010, the numbers start to fluctuate around a certain level (e.g., 2011: 603, 2012: 651, 2013: 619, 2014: 632). Logistic growth is characterized by an initial exponential growth phase followed by a leveling off as the population approaches the carrying capacity due to limiting factors. So the overall growth from 1996 - 2014 follows a logistic (S - shaped) growth curve, where the population grows until it reaches the carrying capacity and then stabilizes or fluctuates around it.

Snap & solve any problem in the app
Get step-by-step solutions on Sovi AI
Photo-based solutions with guided steps
Explore more problems and detailed explanations
Exponential growth curve