QUESTION IMAGE
Question
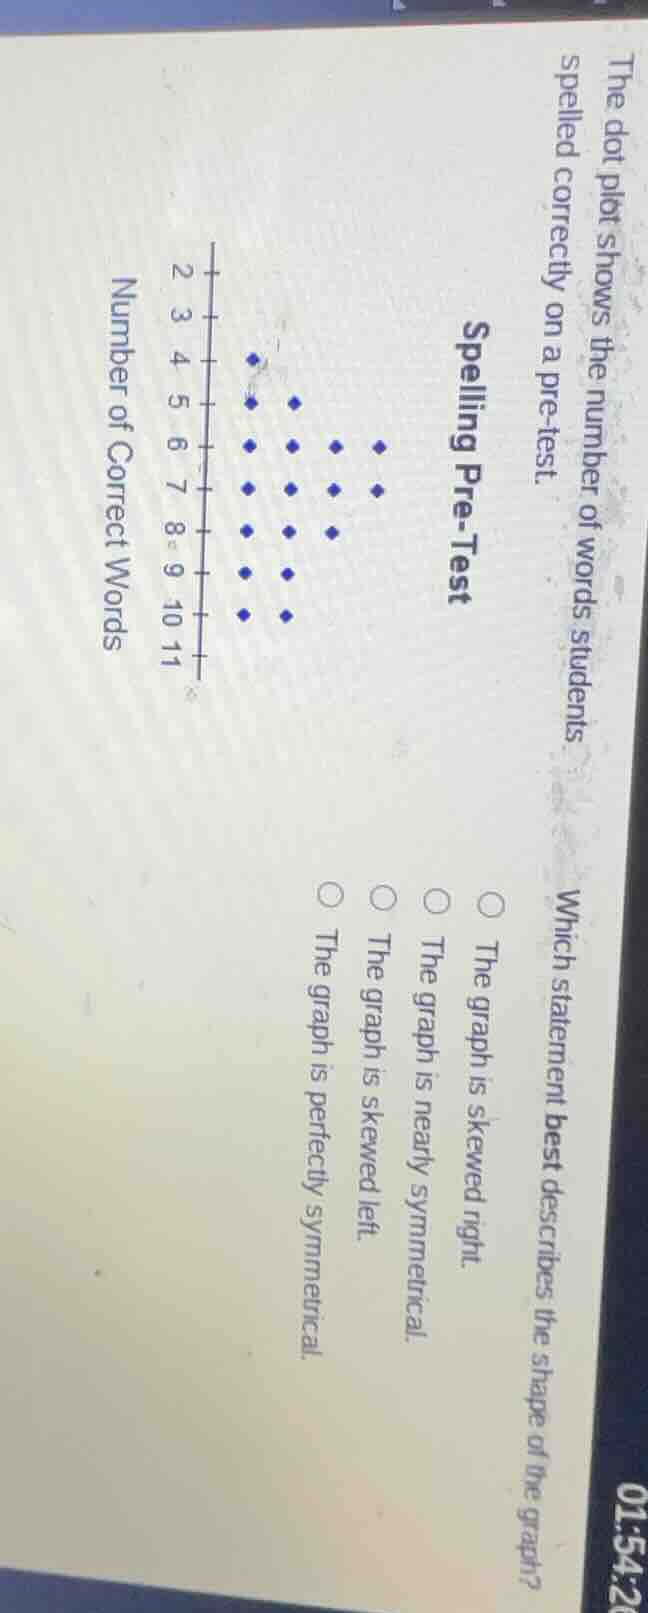
spelling pre-test the dot plot shows the number of words students spelled correctly on a pre - test. number of correct words which statement best describes the shape of the graph? the graph is skewed right. the graph is nearly symmetrical. the graph is skewed left. the graph is perfectly symmetrical.
To determine the shape of the dot - plot, we analyze the distribution of the dots (representing the number of correct words). A symmetric distribution has a mirror - like quality around a central point. A left - skewed distribution has a longer tail on the left, and a right - skewed one has a longer tail on the right. By looking at the dot - plot, we can see that the distribution of the number of correct words is relatively balanced around the middle values. It is not perfectly symmetric (as there might be some minor differences), but it is close to being symmetric. It is not skewed left (no long left tail) or skewed right (no long right tail).

Snap & solve any problem in the app
Get step-by-step solutions on Sovi AI
Photo-based solutions with guided steps
Explore more problems and detailed explanations
The graph is nearly symmetrical.