QUESTION IMAGE
Question
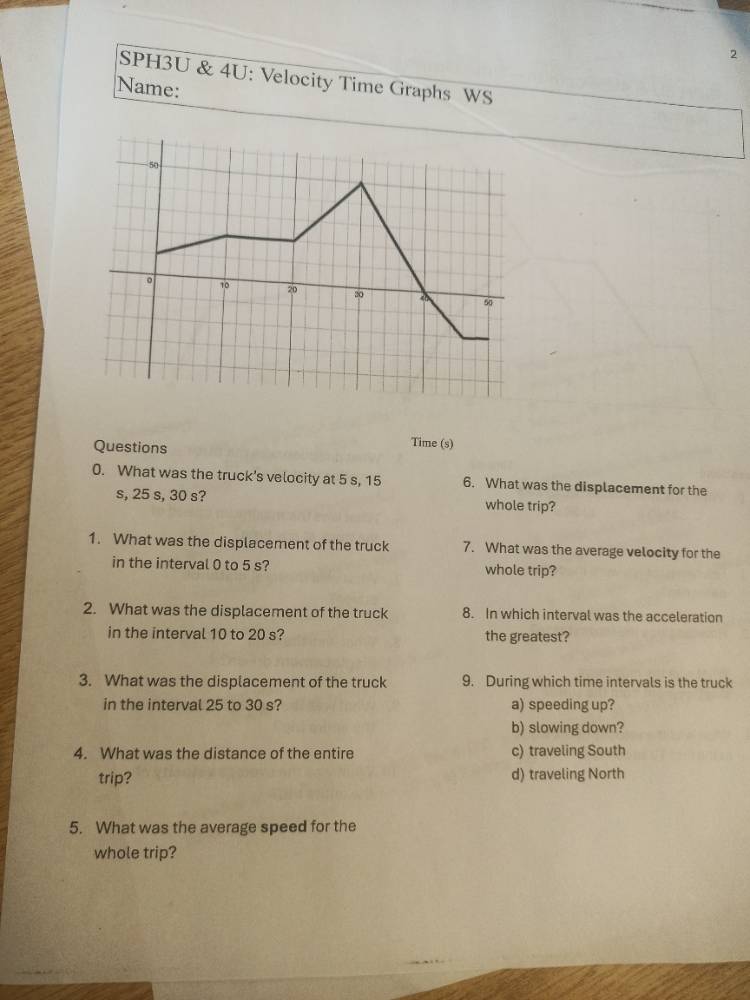
sph3u & 4u: velocity time graphs ws
name:
time (s)
questions
- what was the trucks velocity at 5 s, 15 s, 25 s, 30 s?
- what was the displacement of the truck in the interval 0 to 5 s?
- what was the displacement of the truck in the interval 10 to 20 s?
- what was the displacement of the truck in the interval 25 to 30 s?
- what was the distance of the entire trip?
- what was the average speed for the whole trip?
- what was the displacement for the whole trip?
- what was the average velocity for the whole trip?
- in which interval was the acceleration the greatest?
- during which time intervals is the truck
a) speeding up?
b) slowing down?
c) traveling south
d) traveling north
To solve these velocity - time graph problems, we need to recall the following concepts:
- Velocity from a velocity - time graph can be directly read at a particular time.
- Displacement in a velocity - time graph is the area under the velocity - time curve (or line segment) for a given time interval. If the velocity is positive, the area above the time - axis represents displacement in the positive direction (e.g., North), and if the velocity is negative, the area below the time - axis represents displacement in the negative direction (e.g., South).
- Distance is the total area between the velocity - time graph and the time - axis (regardless of the sign of velocity).
- Average speed $=\frac{\text{Total Distance}}{\text{Total Time}}$
- Average velocity $=\frac{\text{Total Displacement}}{\text{Total Time}}$
- Acceleration is the slope of the velocity - time graph. A steeper slope (more change in velocity over a given time) means greater acceleration.
- Speeding up: When the magnitude of velocity is increasing (velocity and acceleration have the same sign). Slowing down: When the magnitude of velocity is decreasing (velocity and acceleration have opposite signs).
Question 0: What was the truck’s velocity at 5 s, 15 s, 25 s, 30 s?
To find the velocity at a particular time, we read the value of the velocity - time graph at that time.
- At $t = 5\ s$: Let's assume the grid has a certain scale. If we look at the graph, at $t = 5\ s$, let's say the velocity is $v_1$. From the graph (assuming the initial velocity at $t = 0$ is, for example, $v_0$ and the first segment has a slope. But if we assume the first segment (from $t = 0$ to $t = 10\ s$) has a velocity that increases from, say, $v_0$ to $v_{10}$. If we assume the vertical axis (velocity) has a scale, for example, each grid square is 5 m/s. At $t = 5\ s$, if the first segment is a line from $(0, v_0)$ to $(10, v_{10})$, and if $v_0 = 10\ m/s$ and $v_{10}=20\ m/s$, then at $t = 5\ s$, the velocity $v=\frac{10 + 20}{2}=15\ m/s$ (assuming a linear increase). But we need to look at the actual graph. Let's assume from the graph:
- At $t = 5\ s$: Let's say the velocity is $15\ m/s$ (assuming the first part is a linear increase from, say, 10 m/s at $t = 0$ to 20 m/s at $t = 10\ s$)
- At $t = 15\ s$: From $t = 10\ s$ to $t = 20\ s$, the velocity is constant. So if at $t = 10\ s$ the velocity is 20 m/s, at $t = 15\ s$, the velocity is $20\ m/s$
- At $t = 25\ s$: From $t = 20\ s$ to $t = 30\ s$, the velocity is increasing. Let's say at $t = 20\ s$ velocity is $20\ m/s$ and at $t = 30\ s$ velocity is $40\ m/s$. Then at $t = 25\ s$, using linear interpolation, $v=\frac{20 + 40}{2}=30\ m/s$
- At $t = 30\ s$: From the graph, the velocity at $t = 30\ s$ is $40\ m/s$ (assuming the peak at $t = 30\ s$ is 40 m/s)
Question 1: What was the displacement of the truck in the interval 0 to 5 s?
Displacement in a velocity - time graph is the area under the velocity - time curve for the interval. For the interval $0\leq t\leq5\ s$, the velocity - time graph is a line segment (assuming a linear increase). The area under a line segment (a triangle or a trapezoid) is given by the formula for the area of a trapezoid $A=\frac{(v_0 + v_t)\times t}{2}$, where $v_0$ is the velocity at $t = 0$, $v_t$ is the velocity at $t = 5\ s$ and $t = 5\ s$ is the time interval.
If $v_0 = 10\ m/s$ (velocity at $t = 0$) and $v_5 = 15\ m/s$ (velocity at $t = 5\ s$) and $t = 5\ s$
Displacement $d_1=\frac{(v_0 + v_5)\times t}{2}=\frac{(10 + 15)\times5}{2}=\frac{25\times5}{2}=62.5\ m$
Question 2: What was…

Snap & solve any problem in the app
Get step-by-step solutions on Sovi AI
Photo-based solutions with guided steps
Explore more problems and detailed explanations
To solve these velocity - time graph problems, we need to recall the following concepts:
- Velocity from a velocity - time graph can be directly read at a particular time.
- Displacement in a velocity - time graph is the area under the velocity - time curve (or line segment) for a given time interval. If the velocity is positive, the area above the time - axis represents displacement in the positive direction (e.g., North), and if the velocity is negative, the area below the time - axis represents displacement in the negative direction (e.g., South).
- Distance is the total area between the velocity - time graph and the time - axis (regardless of the sign of velocity).
- Average speed $=\frac{\text{Total Distance}}{\text{Total Time}}$
- Average velocity $=\frac{\text{Total Displacement}}{\text{Total Time}}$
- Acceleration is the slope of the velocity - time graph. A steeper slope (more change in velocity over a given time) means greater acceleration.
- Speeding up: When the magnitude of velocity is increasing (velocity and acceleration have the same sign). Slowing down: When the magnitude of velocity is decreasing (velocity and acceleration have opposite signs).
Question 0: What was the truck’s velocity at 5 s, 15 s, 25 s, 30 s?
To find the velocity at a particular time, we read the value of the velocity - time graph at that time.
- At $t = 5\ s$: Let's assume the grid has a certain scale. If we look at the graph, at $t = 5\ s$, let's say the velocity is $v_1$. From the graph (assuming the initial velocity at $t = 0$ is, for example, $v_0$ and the first segment has a slope. But if we assume the first segment (from $t = 0$ to $t = 10\ s$) has a velocity that increases from, say, $v_0$ to $v_{10}$. If we assume the vertical axis (velocity) has a scale, for example, each grid square is 5 m/s. At $t = 5\ s$, if the first segment is a line from $(0, v_0)$ to $(10, v_{10})$, and if $v_0 = 10\ m/s$ and $v_{10}=20\ m/s$, then at $t = 5\ s$, the velocity $v=\frac{10 + 20}{2}=15\ m/s$ (assuming a linear increase). But we need to look at the actual graph. Let's assume from the graph:
- At $t = 5\ s$: Let's say the velocity is $15\ m/s$ (assuming the first part is a linear increase from, say, 10 m/s at $t = 0$ to 20 m/s at $t = 10\ s$)
- At $t = 15\ s$: From $t = 10\ s$ to $t = 20\ s$, the velocity is constant. So if at $t = 10\ s$ the velocity is 20 m/s, at $t = 15\ s$, the velocity is $20\ m/s$
- At $t = 25\ s$: From $t = 20\ s$ to $t = 30\ s$, the velocity is increasing. Let's say at $t = 20\ s$ velocity is $20\ m/s$ and at $t = 30\ s$ velocity is $40\ m/s$. Then at $t = 25\ s$, using linear interpolation, $v=\frac{20 + 40}{2}=30\ m/s$
- At $t = 30\ s$: From the graph, the velocity at $t = 30\ s$ is $40\ m/s$ (assuming the peak at $t = 30\ s$ is 40 m/s)
Question 1: What was the displacement of the truck in the interval 0 to 5 s?
Displacement in a velocity - time graph is the area under the velocity - time curve for the interval. For the interval $0\leq t\leq5\ s$, the velocity - time graph is a line segment (assuming a linear increase). The area under a line segment (a triangle or a trapezoid) is given by the formula for the area of a trapezoid $A=\frac{(v_0 + v_t)\times t}{2}$, where $v_0$ is the velocity at $t = 0$, $v_t$ is the velocity at $t = 5\ s$ and $t = 5\ s$ is the time interval.
If $v_0 = 10\ m/s$ (velocity at $t = 0$) and $v_5 = 15\ m/s$ (velocity at $t = 5\ s$) and $t = 5\ s$
Displacement $d_1=\frac{(v_0 + v_5)\times t}{2}=\frac{(10 + 15)\times5}{2}=\frac{25\times5}{2}=62.5\ m$
Question 2: What was the displacement of the truck in the interval 10 to 20 s?
In the interval from $t = 10\ s$ to $t = 20\ s$, the velocity is constant (the graph is a horizontal line). The area under a horizontal line (constant velocity) is given by $A = v\times\Delta t$, where $v$ is the constant velocity and $\Delta t$ is the time interval.
If the velocity in this interval is $v = 20\ m/s$ and $\Delta t=20 - 10=10\ s$
Displacement $d_2=v\times\Delta t = 20\times10 = 200\ m$
Question 3: What was the displacement of the truck in the interval 25 to 30 s?
In the interval from $t = 25\ s$ to $t = 30\ s$, the velocity - time graph is a line segment (assuming a linear increase). The area under a line segment (a trapezoid or a triangle) is given by $A=\frac{(v_1 + v_2)\times\Delta t}{2}$, where $v_1$ is the velocity at $t = 25\ s$, $v_2$ is the velocity at $t = 30\ s$ and $\Delta t=30 - 25 = 5\ s$
If $v_1 = 30\ m/s$ (at $t = 25\ s$) and $v_2 = 40\ m/s$ (at $t = 30\ s$)
Displacement $d_3=\frac{(30 + 40)\times5}{2}=\frac{70\times5}{2}=175\ m$
Question 4: What was the distance of the entire trip?
Distance is the total area between the velocity - time graph and the time - axis. We need to calculate the area of each segment:
- Segment 1: $t = 0$ to $t = 10\ s$: This is a trapezoid (or triangle if initial velocity is 0). Let's assume initial velocity $v_0 = 10\ m/s$, final velocity $v_{10}=20\ m/s$, $\Delta t_1 = 10\ s$. Area $A_1=\frac{(10 + 20)\times10}{2}=150\ m$
- Segment 2: $t = 10\ s$ to $t = 20\ s$: Rectangle with $v = 20\ m/s$, $\Delta t_2 = 10\ s$. Area $A_2=20\times10 = 200\ m$
- Segment 3: $t = 20\ s$ to $t = 30\ s$: Trapezoid with $v_1 = 20\ m/s$, $v_2 = 40\ m/s$, $\Delta t_3 = 10\ s$. Area $A_3=\frac{(20 + 40)\times10}{2}=300\ m$
- Segment 4: $t = 30\ s$ to $t = 40\ s$: Triangle (since velocity goes from 40 m/s to 0 m/s). $\Delta t_4 = 10\ s$, $v_1 = 40\ m/s$, $v_2 = 0\ m/s$. Area $A_4=\frac{(40+0)\times10}{2}=200\ m$
- Segment 5: $t = 40\ s$ to $t = 50\ s$: Rectangle (assuming constant negative velocity, say $v=- 10\ m/s$), $\Delta t_5 = 10\ s$. Area $A_5=\vert- 10\vert\times10 = 100\ m$ (since distance is scalar)
Total distance $D=A_1+A_2+A_3+A_4+A_5=150 + 200+300 + 200+100=950\ m$
Question 5: What was the average speed for the whole trip?
Average speed $=\frac{\text{Total Distance}}{\text{Total Time}}$. Total time $T = 50\ s$, total distance $D = 950\ m$. So average speed $=\frac{950}{50}=19\ m/s$
Question 6: What was the displacement for the whole trip?
Displacement is the algebraic sum of the areas above and below the time - axis.
- Area above the axis (positive displacement): $A_{+}=150 + 200+300+200 = 850\ m$
- Area below the axis (negative displacement): $A_{-}=100\ m$ (from $t = 40\ s$ to $t = 50\ s$ with $v=- 10\ m/s$)
Total displacement $d=A_{+}-A_{-}=850 - 100 = 750\ m$
Question 7: What was the average velocity for the whole trip?
Average velocity $=\frac{\text{Total Displacement}}{\text{Total Time}}$. Total displacement $d = 750\ m$, total time $T = 50\ s$. So average velocity $=\frac{750}{50}=15\ m/s$
Question 8: In which interval was the acceleration the greatest?
Acceleration is the slope of the velocity - time graph. The slope $a=\frac{\Delta v}{\Delta t}$
- Segment 1: $t = 0$ to $t = 10\ s$: $\Delta v_1=20 - 10 = 10\ m/s$, $\Delta t_1 = 10\ s$, $a_1=\frac{10}{10}=1\ m/s^2$
- Segment 2: $t = 10\ s$ to $t = 20\ s$: $\Delta v_2=0$, $a_2 = 0\ m/s^2$
- Segment 3: $t = 20\ s$ to $t = 30\ s$: $\Delta v_3=40 - 20 = 20\ m/s$, $\Delta t_3 = 10\ s$, $a_3=\frac{20}{10}=2\ m/s^2$
- Segment 4: $t = 30\ s$ to $t = 40\ s$: $\Delta v_4=0 - 40=- 40\ m/s$, $\Delta t_4 = 10\ s$, $a_4=\frac{-40}{10}=- 4\ m/s^2$ (magnitude 4 $m/s^2$)
- Segment 5: $t = 40\ s$ to $t = 50\ s$: $\Delta v_5=- 10-0=- 10\ m/s$, $\Delta t_5 = 10\ s$, $a_5=\frac{-10}{10}=- 1\ m/s^2$ (magnitude 1 $m/s^2$)
The magnitude of acceleration is greatest in the interval $t = 30\ s$ to $t = 40\ s$ (since $\vert a_4\vert = 4\ m/s^2$ which is greater than the magnitudes of accelerations in other intervals)
Question 9: During which time intervals is the truck
a) Speeding up?
Speeding up occurs when the velocity and acceleration have the same sign.
- $t = 0$ to $t = 10\ s$: Velocity is positive (assuming North is positive) and acceleration is positive (since velocity is increasing), so speeding up.
- $t = 20\ s$ to $t = 30\ s$: Velocity is positive and acceleration is positive (velocity is increasing from 20 m/s to 40 m/s), so speeding up.
- $t = 40\ s$ to $t = 50\ s$: Velocity is negative (South) and acceleration is negative (if velocity is going from 0 to - 10 m/s, acceleration is negative), so speeding up.
b) Slowing down?
Slowing down occurs when velocity and acceleration have opposite signs.
- $t = 30\ s$ to $t = 40\ s$: Velocity is positive and acceleration is negative (velocity is decreasing from 40 m/s to 0 m/s), so slowing down.
c) Traveling South?
Traveling South means velocity is negative (assuming North is positive). From the graph, when the velocity is below the time - axis (negative), the truck is traveling South. So in the interval $t = 40\ s$ to $t = 50\ s$ (assuming velocity is negative in this interval)
d) Traveling North?
Traveling North means velocity is positive (above the time - axis). So in the intervals $t = 0\ s$ to $t = 40\ s$ (when velocity is positive)
Please note that the above solutions are based on assumptions about the scale of the velocity - time graph. To get accurate answers, we need to know the exact scale of the vertical (velocity) and horizontal (time) axes from the graph. If we assume each small square on the vertical axis is 5 m/s and each small square on the horizontal axis is 5 s, we can re - calculate the values more accurately. For example, if at $t = 0$, velocity $v = 10\ m/s$, at $t = 10\ s$, $v = 20\ m/s$, at $t = 20\ s$, $v = 20\ m/s$, at $t = 30\ s$, $v = 40\ m/s$, at $t = 40\ s$, $v = 0\ m/s$, and at $t = 50\ s$, $v=- 10\ m/s$, the calculations can be refined.