QUESTION IMAGE
Question
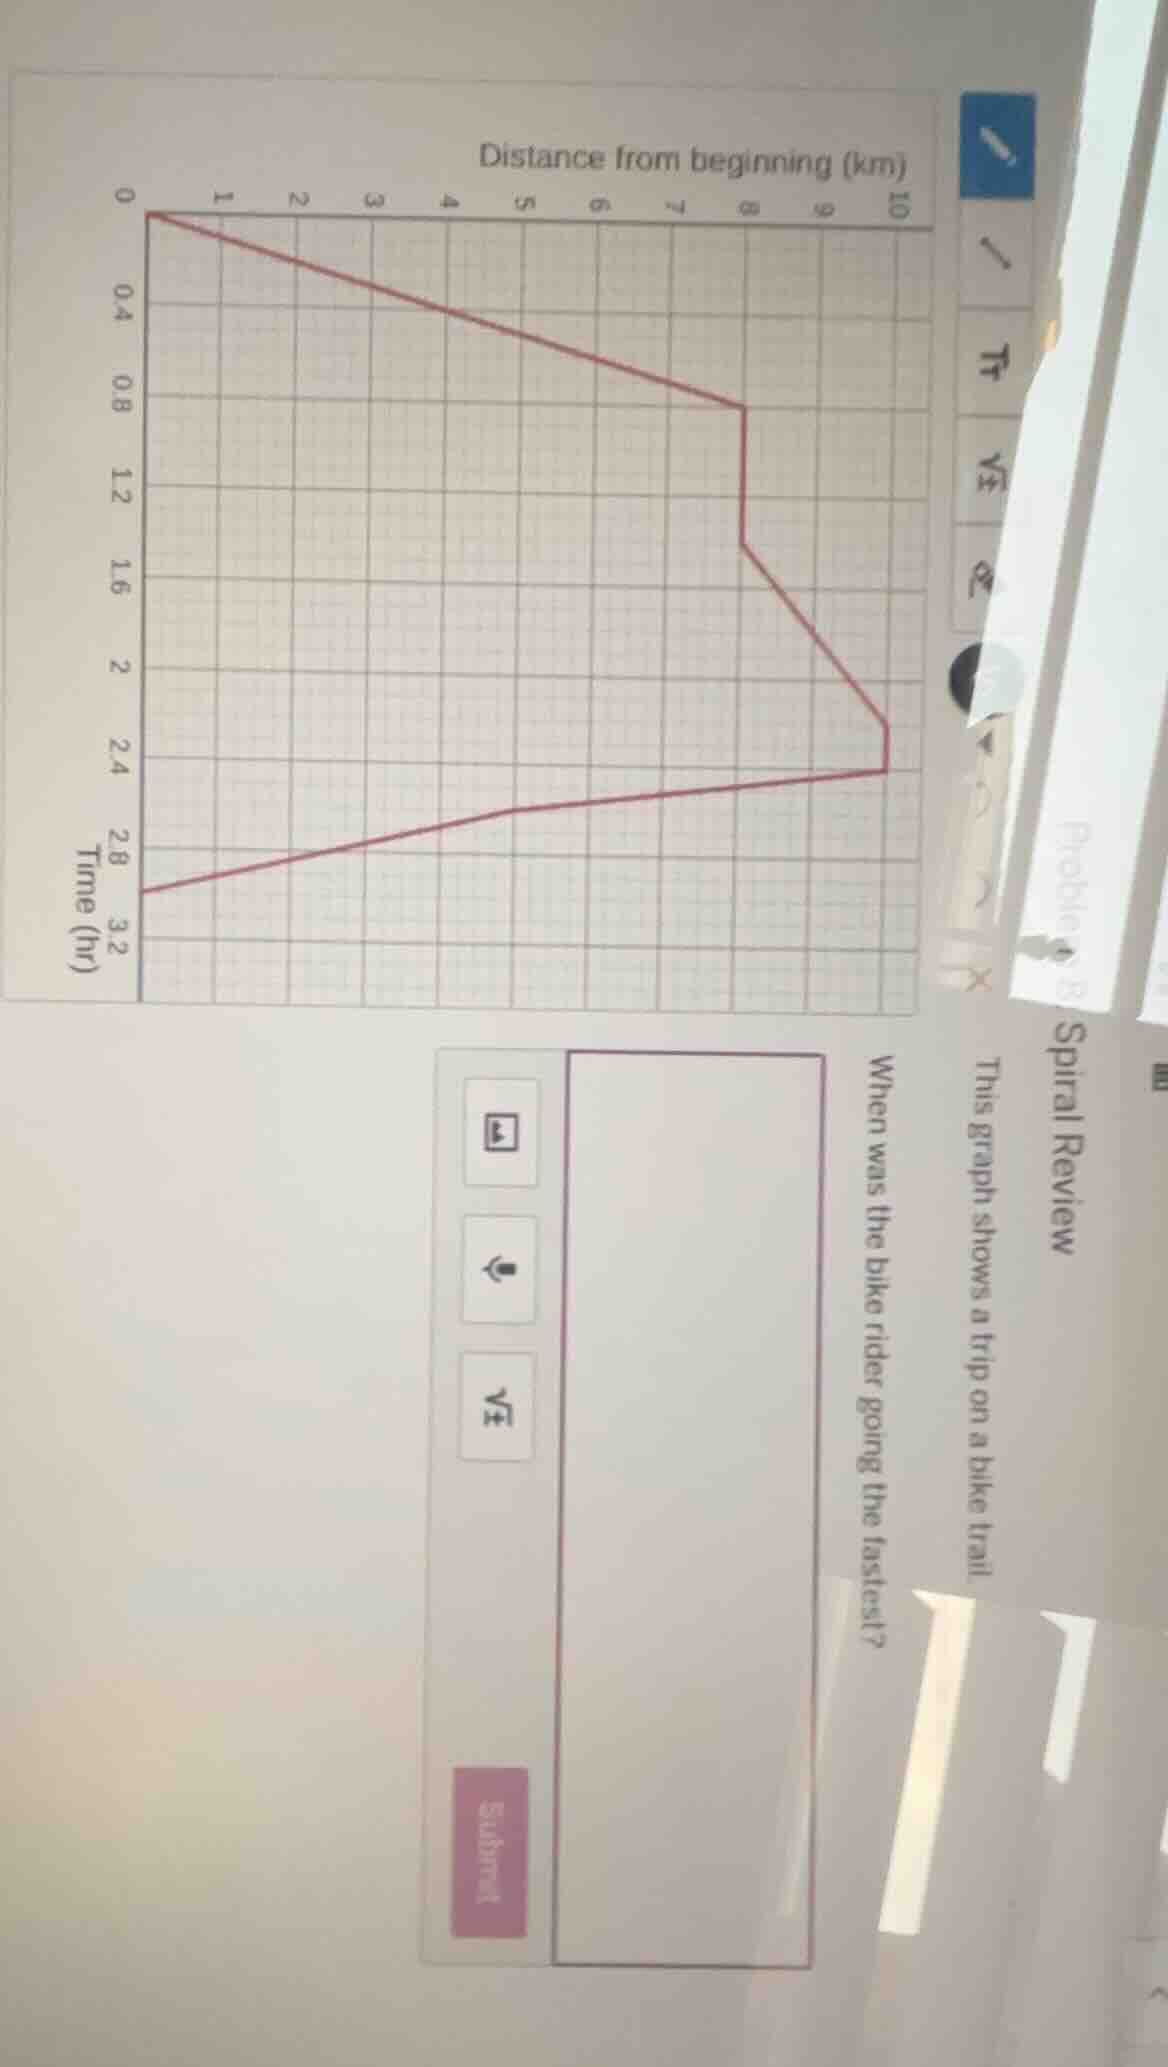
spiral review
this graph shows a trip on a bike trail.
when was the bike rider going the fastest?
To determine when the bike rider was going the fastest, we analyze the slope of the distance - time graph. The formula for speed is \(v=\frac{\Delta d}{\Delta t}\), where \(\Delta d\) is the change in distance and \(\Delta t\) is the change in time. A steeper slope on a distance - time graph means a higher speed because a steeper slope implies a larger \(\frac{\Delta d}{\Delta t}\) (more distance covered in less time).
Step 1: Analyze the slope concept
In a distance - time graph, the slope of the line segment represents the speed of the object (the bike rider in this case). Mathematically, slope \(m = \frac{y_2 - y_1}{x_2 - x_1}\), where \(y\) - values represent distance and \(x\) - values represent time. A larger absolute value of the slope indicates a higher speed.
Step 2: Examine the graph segments
We look at each line segment on the given distance - time graph. The segment with the steepest slope (the one where the line is the most "vertical" or has the greatest change in distance for a given change in time) corresponds to the highest speed. By visually inspecting the graph, we can see that the segment where the distance changes the most over a short period of time (the steepest part) occurs at the beginning or at a particular interval. From the graph, the part of the graph with the steepest slope (the most rapid change in distance with respect to time) is when the line has the greatest inclination. Looking at the graph, the segment that is the steepest (indicating the highest speed) is the one where the rider is moving such that the distance from the beginning is changing rapidly with time. Typically, in such graphs, the steepest slope (highest speed) occurs when the line is the most inclined. From the given graph, the part where the rider is going the fastest is when the slope of the distance - time graph is the steepest. By looking at the graph, we can see that the segment with the steepest slope (the one with the greatest rate of change of distance with respect to time) is the one that corresponds to the time when the rider is moving the fastest.

Snap & solve any problem in the app
Get step-by-step solutions on Sovi AI
Photo-based solutions with guided steps
Explore more problems and detailed explanations
To determine when the bike rider was going the fastest, we use the concept that in a distance - time graph, the slope of the line represents speed (\(v=\frac{\Delta d}{\Delta t}\)). A steeper slope means a higher speed. By examining the graph, the segment with the steepest slope (the most rapid change in distance over time) occurs at the time interval corresponding to the steepest line segment. From the visual inspection of the graph, the bike rider was going the fastest during the interval where the slope of the distance - time graph was the steepest (usually, we can identify this by looking for the line segment that is the most inclined). For example, if we consider the segments, the part of the graph with the steepest slope (highest \(\frac{\Delta d}{\Delta t}\)) is when the rider is moving the fastest. If we assume the graph has segments, the steepest segment (by visual analysis) shows the highest speed. So, the bike rider was going the fastest at the time corresponding to the steepest line segment on the distance - time graph (for example, if we look at the graph, the segment with the steepest slope, say, when the time is in a certain range, but from the graph's visual, the steepest part gives the highest speed).
(Note: Since the graph is a bit unclear in terms of exact time labels, but the key is that the steepest slope on the distance - time graph gives the highest speed. So the answer is that the bike rider was going the fastest when the slope of the distance - time graph was the steepest, which can be identified by the steepest line segment on the graph.)