QUESTION IMAGE
Question
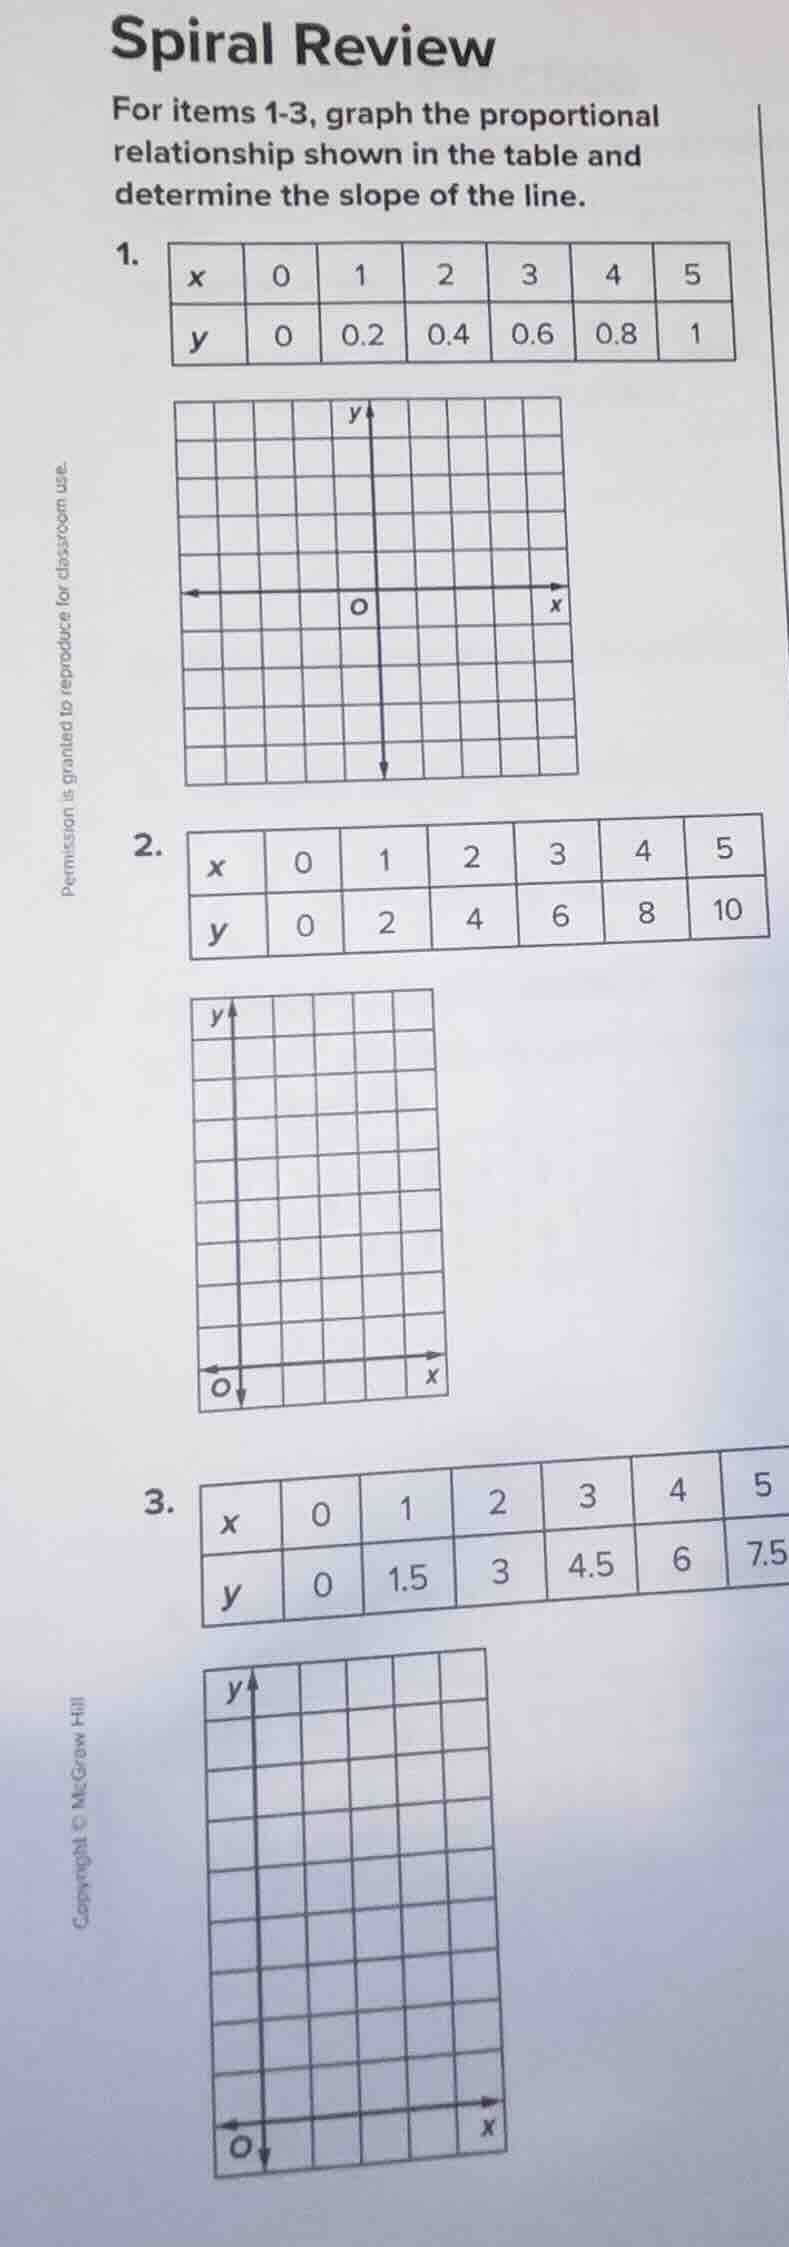
spiral review
for items 1-3, graph the proportional
relationship shown in the table and
determine the slope of the line.
1.
| x | 0 | 1 | 2 | 3 | 4 | 5 |
| y | 0 | 0.2 | 0.4 | 0.6 | 0.8 | 1 |
graph
2.
| x | 0 | 1 | 2 | 3 | 4 | 5 |
| y | 0 | 2 | 4 | 6 | 8 | 10 |
graph
3.
| x | 0 | 1 | 2 | 3 | 4 | 5 |
| y | 0 | 1.5 | 3 | 4.5 | 6 | 7.5 |
graph
Step1: Identify slope formula
Slope $m = \frac{y_2 - y_1}{x_2 - x_1}$
Step2: Calculate slope for Q1
Use points $(0,0)$ and $(1,0.2)$:
$m_1 = \frac{0.2 - 0}{1 - 0} = 0.2 = \frac{1}{5}$
Step3: Calculate slope for Q2
Use points $(0,0)$ and $(1,2)$:
$m_2 = \frac{2 - 0}{1 - 0} = 2$
Step4: Calculate slope for Q3
Use points $(0,0)$ and $(1,1.5)$:
$m_3 = \frac{1.5 - 0}{1 - 0} = 1.5 = \frac{3}{2}$
Step5: Plot points for Q1
Plot $(0,0), (1,0.2), (2,0.4), (3,0.6), (4,0.8), (5,1)$ and draw a straight line through them.
Step6: Plot points for Q2
Plot $(0,0), (1,2), (2,4), (3,6), (4,8), (5,10)$ and draw a straight line through them.
Step7: Plot points for Q3
Plot $(0,0), (1,1.5), (2,3), (3,4.5), (4,6), (5,7.5)$ and draw a straight line through them.

Snap & solve any problem in the app
Get step-by-step solutions on Sovi AI
Photo-based solutions with guided steps
Explore more problems and detailed explanations
- Slope: $\frac{1}{5}$ (or 0.2); Graph: Straight line through the plotted points above
- Slope: $2$; Graph: Straight line through the plotted points above
- Slope: $\frac{3}{2}$ (or 1.5); Graph: Straight line through the plotted points above