QUESTION IMAGE
Question
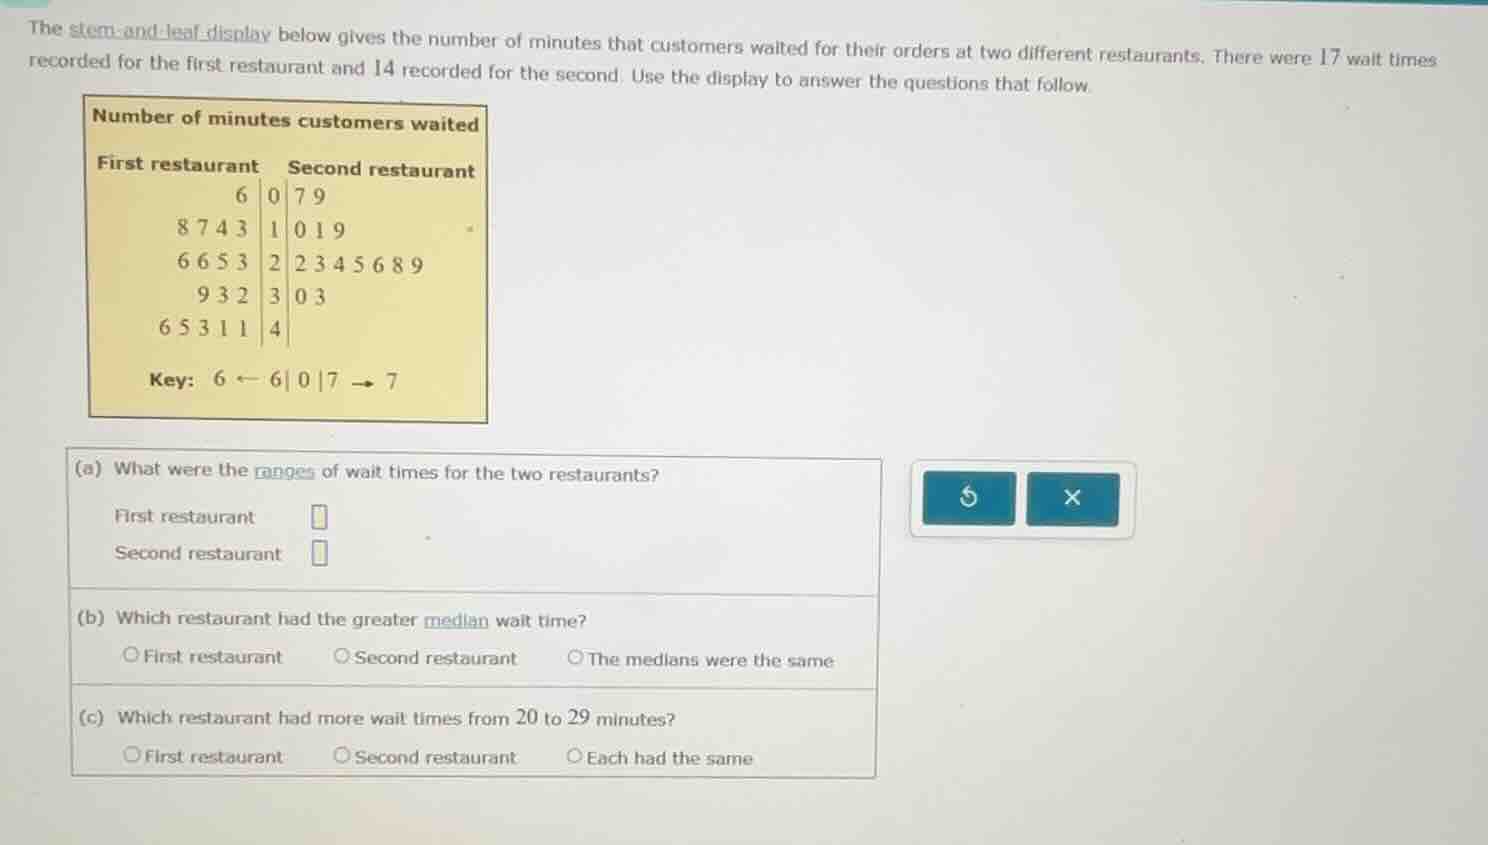
the stem - and - leaf display below gives the number of minutes that customers waited for their orders at two different restaurants. there were 17 wait times recorded for the first restaurant and 14 recorded for the second. use the display to answer the questions that follow.
number of minutes customers waited
first restaurant second restaurant
6 | 0 | 7 9
8 7 4 3 | 1 | 0 1 9
6 6 5 3 | 2 | 2 3 4 5 6 8 9
9 3 2 | 3 | 0 3
6 5 3 1 1 | 4 |
key: 6 ← 6|0|7 → 7
(a) what were the ranges of wait times for the two restaurants?
first restaurant
second restaurant
(b) which restaurant had the greater median wait time?
○first restaurant ○second restaurant ○the medians were the same
(c) which restaurant had more wait times from 20 to 29 minutes?
○first restaurant ○second restaurant ○each had the same
Part (a)
First Restaurant:
Step1: Find max and min wait times.
The stem-and-leaf plot for the first restaurant: the minimum wait time is when stem is 0, leaf is 6, so \( 0\times10 + 6 = 6 \) minutes. The maximum wait time is when stem is 4, leaf is 6 (or any of the 4 - stem leaves, the largest leaf here is 6? Wait, no, the stem 4 has leaves 6,5,3,1,1. Wait, stem is the tens place, leaf is the ones. So for first restaurant:
Stem 0: leaf 6 → 6 minutes (min)
Stem 4: leaves 6,5,3,1,1 → the largest is 6, so \( 4\times10 + 6 = 46 \) minutes (max)
Step2: Calculate range (max - min).
Range = \( 46 - 6 = 40 \)
Second Restaurant:
Step1: Find max and min wait times.
Minimum wait time: stem 0, leaf 7 → \( 0\times10 + 7 = 7 \) minutes.
Maximum wait time: stem 3, leaf 3 → \( 3\times10 + 3 = 33 \) minutes? Wait, no, stem 2 has leaves 2,2,3,4,5,6,8,9; stem 3 has leaves 0,3. Wait, the largest stem is 3, largest leaf in stem 3 is 3? Wait, no, stem 2's largest leaf is 9, so \( 2\times10 + 9 = 29 \)? Wait, no, wait the second restaurant's stem - leaf:
Stem 0: 7,9 → 7,9
Stem 1: 0,1,9 → 10,11,19
Stem 2: 2,2,3,4,5,6,8,9 → 22,22,23,24,25,26,28,29
Stem 3: 0,3 → 30,33
Ah, so maximum wait time is 33 (stem 3, leaf 3), minimum is 7 (stem 0, leaf 7).
Step2: Calculate range (max - min).
Range = \( 33 - 7 = 26 \)
Part (b)
First Restaurant (17 wait times):
Step1: Find the median position.
For \( n = 17 \) (odd), median is the \( \frac{17 + 1}{2} = 9 \)-th value when ordered.
Let's list the wait times for first restaurant (ordered):
Stem 0: 6
Stem 1: 13,14,17,18 (wait, stem 1 leaves: 3,4,7,8 → so 13,14,17,18? Wait no, stem is tens, leaf is ones. So stem 1: leaf 3 → 13, leaf 4 →14, leaf 7→17, leaf 8→18. So ordered: 6,13,14,17,18,
Stem 2: leaves 3,5,6,6,6 → 23,25,26,26,26
Stem 3: leaves 2,3,9 → 32,33,39
Stem 4: leaves 1,1,3,5,6 → 41,41,43,45,46
Now let's count the order:
1: 6
2:13
3:14
4:17
5:18
6:23
7:25
8:26
9:26 (9th value) → median is 26.
Second Restaurant (14 wait times):
Step1: Find the median position.
For \( n = 14 \) (even), median is the average of the \( \frac{14}{2} = 7 \)-th and \( 8 \)-th values.
List the wait times for second restaurant (ordered):
Stem 0:7,9 →7,9
Stem 1:10,11,19 →10,11,19
Stem 2:22,22,23,24,25,26,28,29 →22,22,23,24,25,26,28,29
Stem 3:30,33 →30,33
Now order all:
1:7
2:9
3:10
4:11
5:19
6:22
7:22 (7th)
8:23 (8th)
Median = \( \frac{22 + 23}{2} = 22.5 \)
Compare medians: First restaurant median (26) > Second restaurant median (22.5). So first restaurant has greater median.
Part (c)
First Restaurant (wait times 20 - 29 minutes: stem 2)
Step1: Count leaves in stem 2 for first restaurant.
Stem 2 (tens place 2, so 20 - 29 minutes) has leaves 6,6,5,3 → wait, no, stem 2 leaves: 6,6,5,3? Wait the first restaurant's stem 2: leaves 6,6,5,3? Wait the plot says "6 6 5 3 | 2" → so leaves are 3,5,6,6? Wait, stem 2: leaves are 3,5,6,6? Wait the original plot: "6 6 5 3 | 2" → so the leaves are 3,5,6,6? Wait, no, the order in stem - leaf is usually from left to right, but when reading, we list them in order. Wait, the first restaurant's stem 2: "6 6 5 3 | 2" → so the leaves are 3,5,6,6? Wait, no, maybe it's 3,5,6,6? Wait, no, the user's plot: "6 6 5 3 | 2" → so the leaves are 3,5,6,6? Wait, no, maybe I misread. Wait the first restaurant's stem 2: "6 6 5 3 | 2" → so the leaves are 3,5,6,6? Wait, no, the stem is 2, so the wait times are 23,25,26,26? Wait, no, stem 2: tens digit 2, leaf is ones digit. So leaf 3 →23, leaf 5→25, leaf 6→26, leaf 6→26. So that's 4 values? Wait no, the original plot: "6 6 5 3 | 2" → maybe the leaves are 3,5,6,6? Wait, no, maybe it's 3,5,6,6? Wait, no, the first restaurant's stem 2: "6 6 5 3 | 2" → so the number of leaves is 4? Wait, no, the problem says first restaurant has 17 wait times. Let's recount:
Stem 0: 1 (leaf 6)
Stem 1: 4 (leaves 3,4,7,8 → 13,14,17,18)
Stem 2: 4 (leaves 3,5,6,6 → 23,25,26,26)
Stem 3: 3 (leaves 2,3,9 → 32,33,39)
Stem 4: 5 (leaves 1,1,3,5,6 → 41,41,43,45,46)
Total: 1 + 4 + 4 + 3 + 5 = 17. Correct. So stem 2 (20 - 29) has 4 leaves? Wait no, 4 values? Wait 3,5,6,6 → four values?
Wait the second restaurant's stem 2 (20 - 29 minutes) has leaves 2,2,3,4,5,6,8,9 → that's 8 leaves (values: 22,22,23,24,25,26,28,29). So first restaurant has 4, second has 8? Wait no, wait the first restaurant's stem 2: "6 6 5 3 | 2" → maybe the leaves are 3,5,6,6? Wait, no, maybe I misread. Wait the user's plot: "6 6 5 3 | 2" → so the leaves are 3,5,6,6? So 4 values. Second restaurant's stem 2: "2 2 3 4 5 6 8 9 | 2" → 8 values. So second restaurant has more wait times from 20 - 29 minutes.
Final Answers:
(a) First restaurant range: \(\boldsymbol{40}\), Second restaurant range: \(\boldsymbol{26}\)
(b) The restaurant with greater median wait time: \(\boldsymbol{\text{First restaurant}}\)
(c) The restaurant with more wait times from 20 to 29 minutes: \(\boldsymbol{\text{Second restaurant}}\)

Snap & solve any problem in the app
Get step-by-step solutions on Sovi AI
Photo-based solutions with guided steps
Explore more problems and detailed explanations
Step1: Count leaves in stem 2 for first restaurant.
Stem 2 (tens place 2, so 20 - 29 minutes) has leaves 6,6,5,3 → wait, no, stem 2 leaves: 6,6,5,3? Wait the first restaurant's stem 2: leaves 6,6,5,3? Wait the plot says "6 6 5 3 | 2" → so leaves are 3,5,6,6? Wait, stem 2: leaves are 3,5,6,6? Wait the original plot: "6 6 5 3 | 2" → so the leaves are 3,5,6,6? Wait, no, the order in stem - leaf is usually from left to right, but when reading, we list them in order. Wait, the first restaurant's stem 2: "6 6 5 3 | 2" → so the leaves are 3,5,6,6? Wait, no, maybe it's 3,5,6,6? Wait, no, the user's plot: "6 6 5 3 | 2" → so the leaves are 3,5,6,6? Wait, no, maybe I misread. Wait the first restaurant's stem 2: "6 6 5 3 | 2" → so the leaves are 3,5,6,6? Wait, no, the stem is 2, so the wait times are 23,25,26,26? Wait, no, stem 2: tens digit 2, leaf is ones digit. So leaf 3 →23, leaf 5→25, leaf 6→26, leaf 6→26. So that's 4 values? Wait no, the original plot: "6 6 5 3 | 2" → maybe the leaves are 3,5,6,6? Wait, no, maybe it's 3,5,6,6? Wait, no, the first restaurant's stem 2: "6 6 5 3 | 2" → so the number of leaves is 4? Wait, no, the problem says first restaurant has 17 wait times. Let's recount:
Stem 0: 1 (leaf 6)
Stem 1: 4 (leaves 3,4,7,8 → 13,14,17,18)
Stem 2: 4 (leaves 3,5,6,6 → 23,25,26,26)
Stem 3: 3 (leaves 2,3,9 → 32,33,39)
Stem 4: 5 (leaves 1,1,3,5,6 → 41,41,43,45,46)
Total: 1 + 4 + 4 + 3 + 5 = 17. Correct. So stem 2 (20 - 29) has 4 leaves? Wait no, 4 values? Wait 3,5,6,6 → four values?
Wait the second restaurant's stem 2 (20 - 29 minutes) has leaves 2,2,3,4,5,6,8,9 → that's 8 leaves (values: 22,22,23,24,25,26,28,29). So first restaurant has 4, second has 8? Wait no, wait the first restaurant's stem 2: "6 6 5 3 | 2" → maybe the leaves are 3,5,6,6? Wait, no, maybe I misread. Wait the user's plot: "6 6 5 3 | 2" → so the leaves are 3,5,6,6? So 4 values. Second restaurant's stem 2: "2 2 3 4 5 6 8 9 | 2" → 8 values. So second restaurant has more wait times from 20 - 29 minutes.
Final Answers:
(a) First restaurant range: \(\boldsymbol{40}\), Second restaurant range: \(\boldsymbol{26}\)
(b) The restaurant with greater median wait time: \(\boldsymbol{\text{First restaurant}}\)
(c) The restaurant with more wait times from 20 to 29 minutes: \(\boldsymbol{\text{Second restaurant}}\)