QUESTION IMAGE
Question
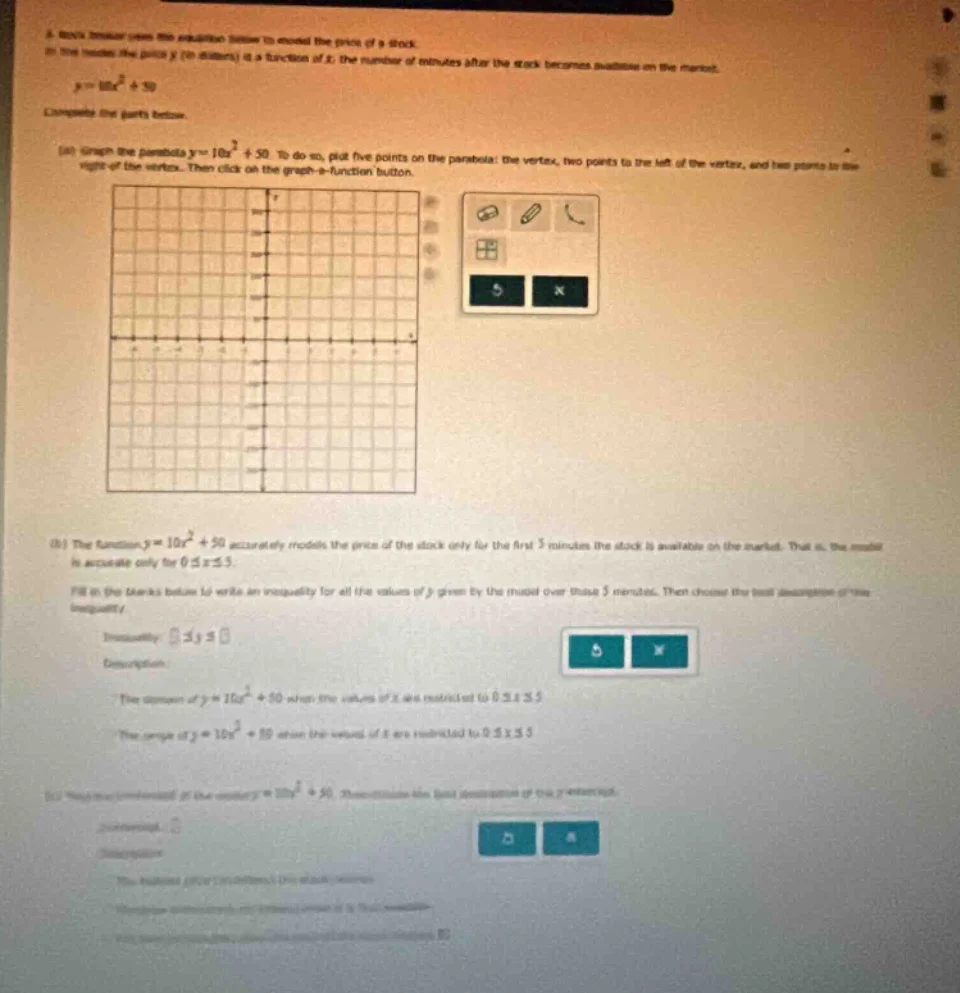
a stock trader uses the equation below to model the price of a stock.
in the model, the price y (in dollars) is a function of x: the number of minutes after the stock becomes available on the market.
$y = 10x^{2}+50$
complete the parts below.
(a) graph the parabola $y = 10x^{2}+50$. to do so, plot five points on the parabola: the vertex, two points to the left of the vertex, and two points to the right of the vertex. then click on the graph-a-function button.
(b) the function $y = 10x^{2}+50$ accurately models the price of the stock only for the first 5 minutes the stock is available on the market. that is, the model is accurate only for $0\leq x\leq5$.
fill in the blanks below to write an inequality for all the values of y given by the model over those 5 minutes. then choose the best description of the inequality.
inequality: $\square\leq y\leq\square$
description:
the domain of $y = 10x^{2}+50$ when the values of x are restricted to $0\leq x\leq5$
the range of $y = 10x^{2}+50$ when the values of x are restricted to $0\leq x\leq5$
(c) find the y-intercept of $y = 10x^{2}+50$. then choose the best description of the y-intercept.
y-intercept: $\square$
description:
the initial price of the stock when it becomes available
the number of minutes until the price of the stock reaches its maximum value
Step1: Find vertex of parabola
For $y=10x^2+50$, vertex at $x=0$:
$y=10(0)^2+50=50$
Vertex: $(0, 50)$
Step2: Pick left vertex points
Choose $x=-1, -2$:
$x=-1$: $y=10(-1)^2+50=60$ → $(-1, 60)$
$x=-2$: $y=10(-2)^2+50=90$ → $(-2, 90)$
Step3: Pick right vertex points
Choose $x=1, 2$:
$x=1$: $y=10(1)^2+50=60$ → $(1, 60)$
$x=2$: $y=10(2)^2+50=90$ → $(2, 90)$
(Plot these 5 points and draw the parabola)
Step4: Find range for $0\le x\le5$
Min $y$ at $x=0$: $y=50$
Max $y$ at $x=5$: $y=10(5)^2+50=300$
Inequality: $50\le y\le300$
Description: The range of $y=10x^2 + 50$ when the values of $x$ are restricted to $0\le x\le5$
Step5: Identify y-intercept
Y-intercept at $x=0$: $y=50$
Description: The initial price of the stock when it became available
---

Snap & solve any problem in the app
Get step-by-step solutions on Sovi AI
Photo-based solutions with guided steps
Explore more problems and detailed explanations
(a) Plot points: $(0,50)$, $(-1,60)$, $(-2,90)$, $(1,60)$, $(2,90)$; draw the upward-opening parabola.
(b) Inequality: $\boldsymbol{50\le y\le300}$; Select: The range of $y=10x^2 + 50$ when the values of $x$ are restricted to $0\le x\le5$
(c) Intercept: $\boldsymbol{50}$; Select: The initial price of the stock when it became available