QUESTION IMAGE
Question
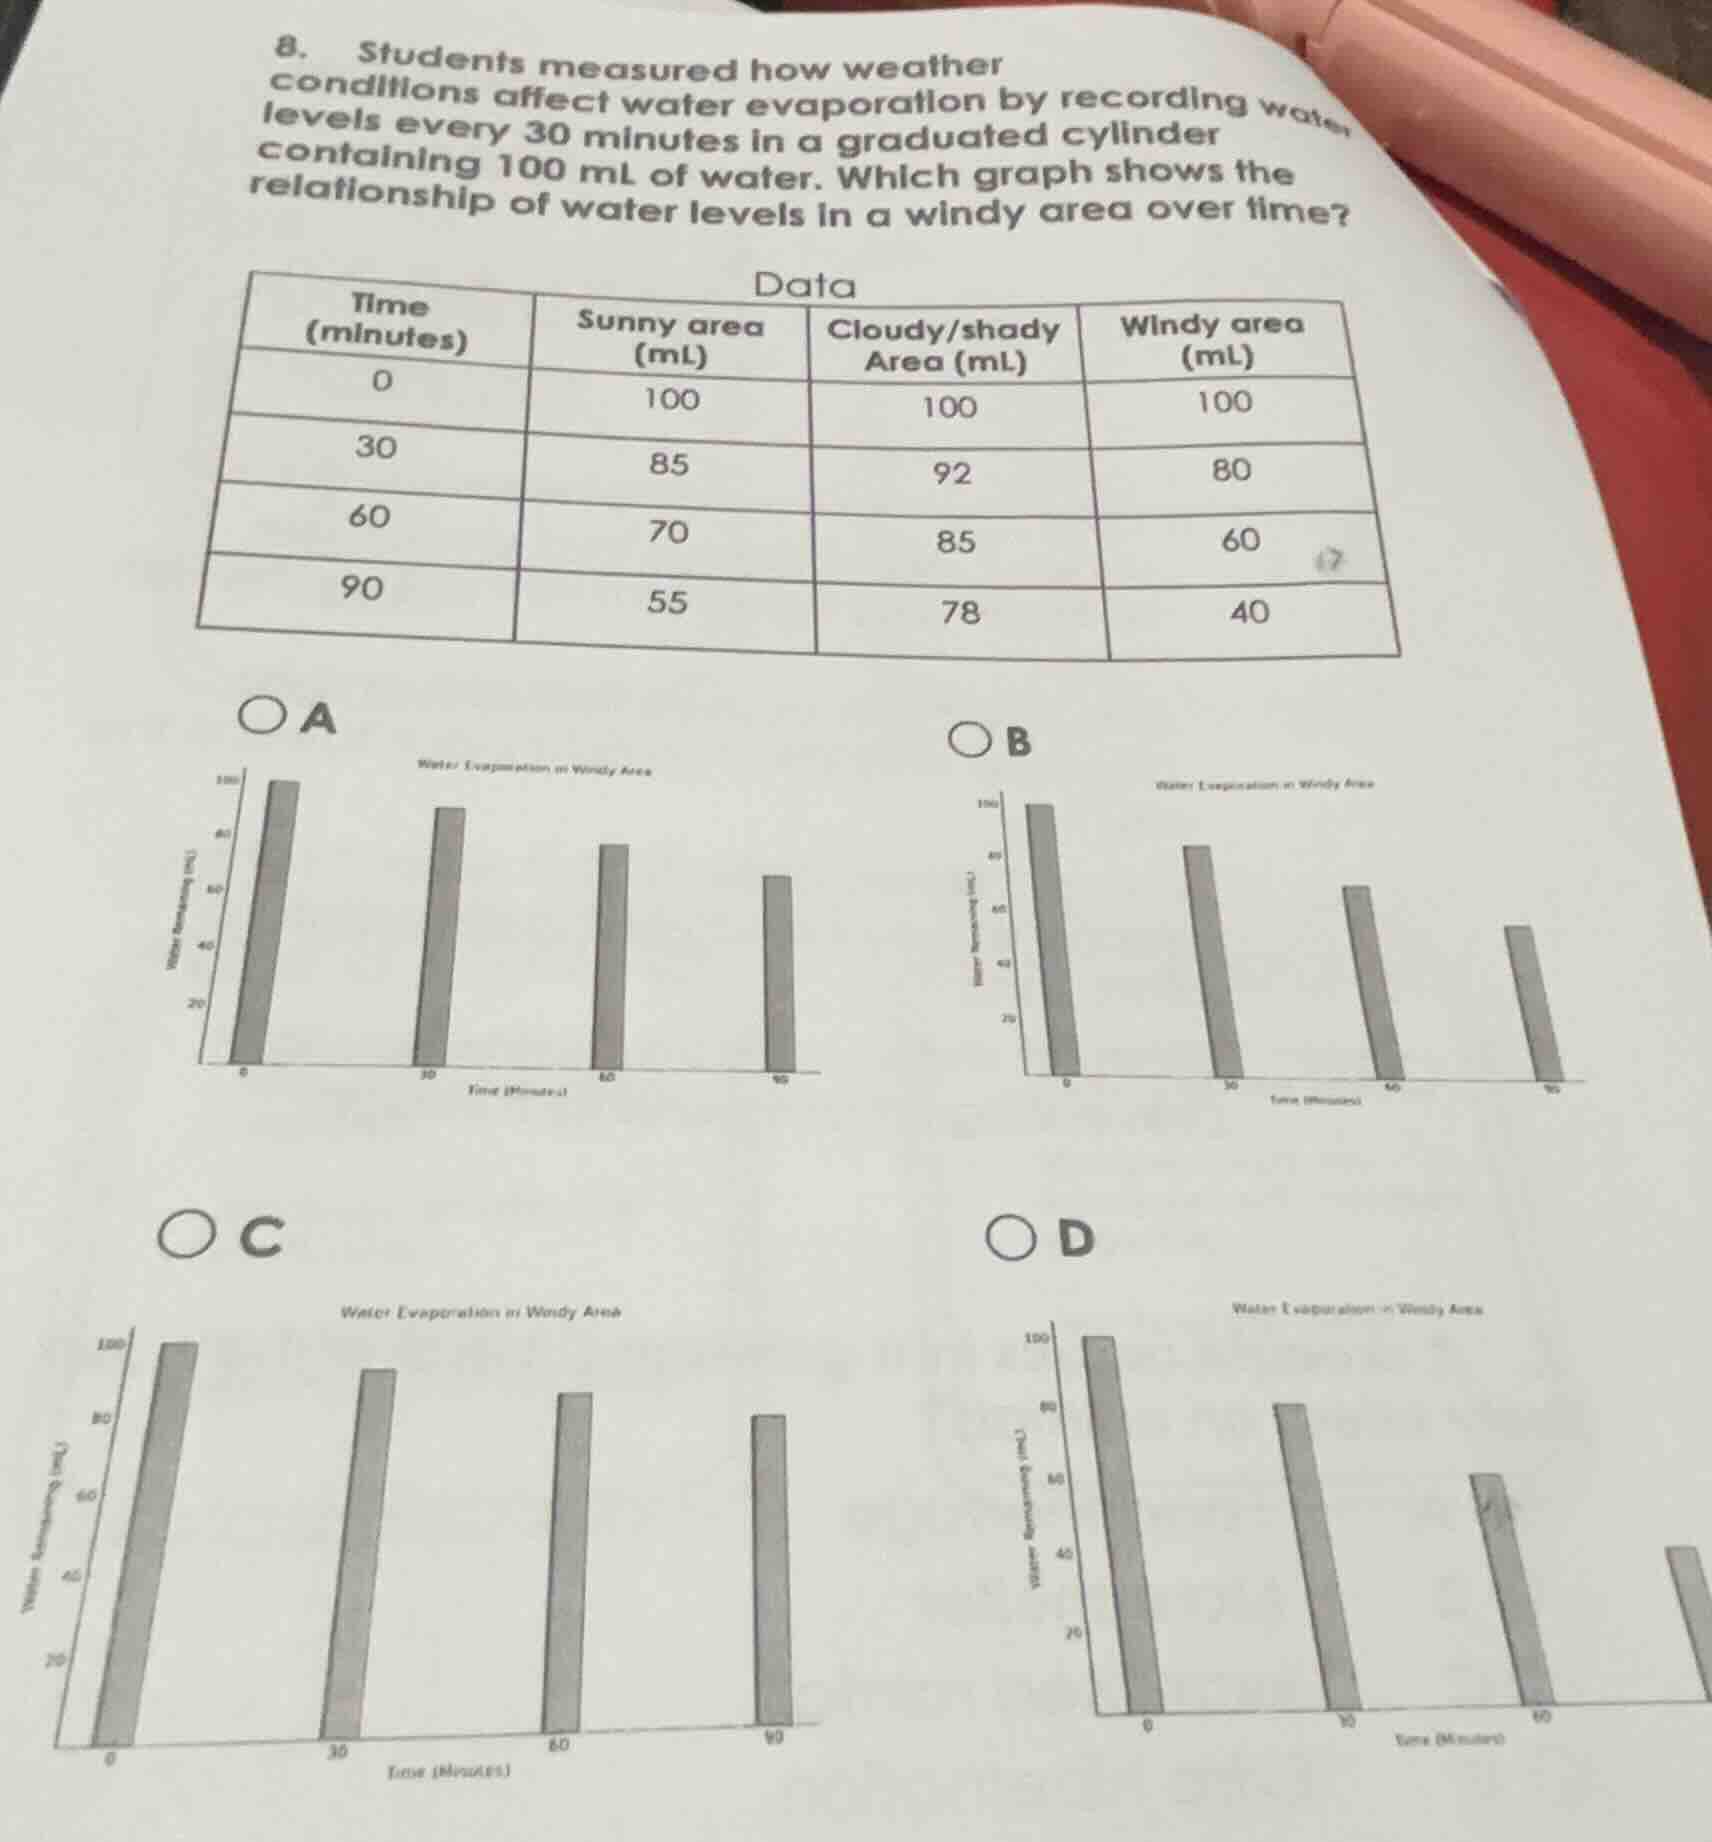
- students measured how weather conditions affect water evaporation by recording water levels every 30 minutes in a graduated cylinder containing 100 ml of water. which graph shows the relationship of water levels in a windy area over time? data time (minutes) sunny area (ml) cloudy/shady area (ml) windy area (ml) 0 100 100 100 30 85 92 80 60 70 85 60 90 55 78 40 a b c d
Step1: Extract windy area data
Time (min): 0, 30, 60, 90; Water (mL): 100, 80, 60, 40
Step2: Match data to bar graphs
Check each graph's bar heights for the values: 100, 80, 60, 40. Graph D has bars matching these values exactly.

Snap & solve any problem in the app
Get step-by-step solutions on Sovi AI
Photo-based solutions with guided steps
Explore more problems and detailed explanations
D. Water Evaporation in Windy Area (bar graph with heights 100, 80, 60, 40 at 0, 30, 60, 90 minutes)