QUESTION IMAGE
Question
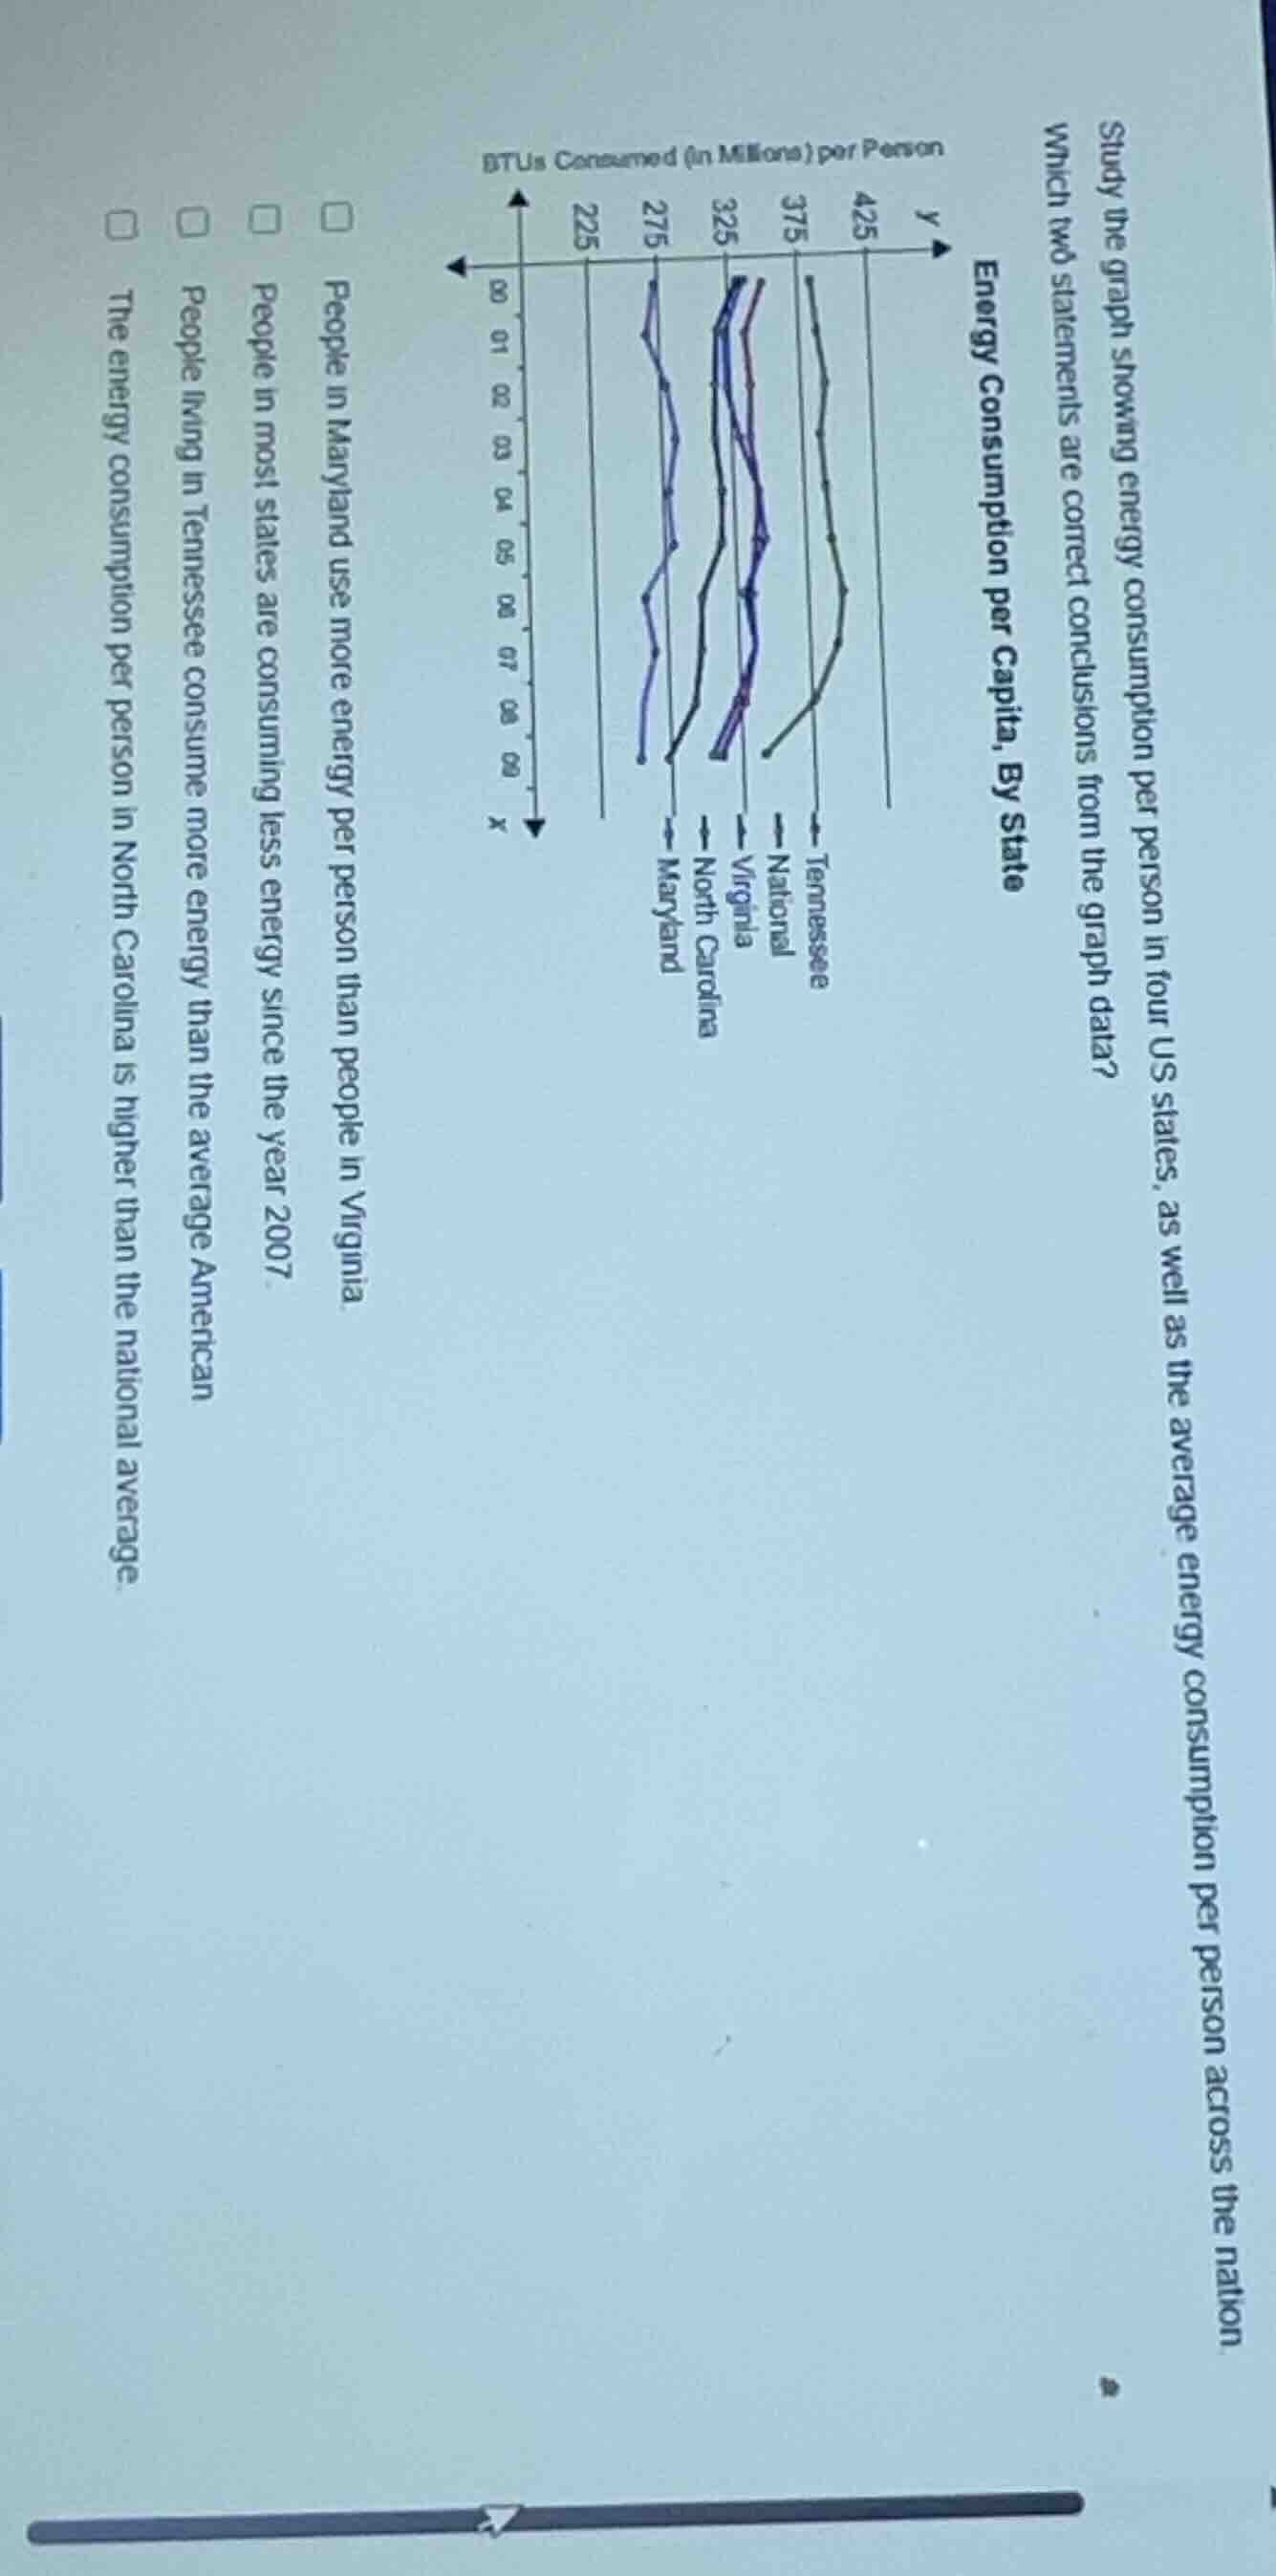
study the graph showing energy consumption per person in four us states, as well as the average energy consumption per person across the nation. which two statements are correct conclusions from the graph data? energy consumption per capita, by state btus consumed (in millions) per person people in maryland use more energy per person than people in virginia people in most states are consuming less energy since the year 2007 people living in tennessee consume more energy than the average american the energy consumption per person in north carolina is higher than the national average
Brief Explanations
- For the first statement: Maryland's energy consumption line is consistently below Virginia's line on the graph, so this is false.
- For the second statement: All lines (Maryland, North Carolina, Virginia, National) show a downward trend starting around 2007, so this is true.
- For the third statement: Tennessee's line is consistently above the National line, so this is true.
- For the fourth statement: North Carolina's line is consistently below the National line, so this is false.

Snap & solve any problem in the app
Get step-by-step solutions on Sovi AI
Photo-based solutions with guided steps
Explore more problems and detailed explanations
- People in most states are consuming less energy since the year 2007.
- People living in Tennessee consume more energy than the average American