QUESTION IMAGE
Question
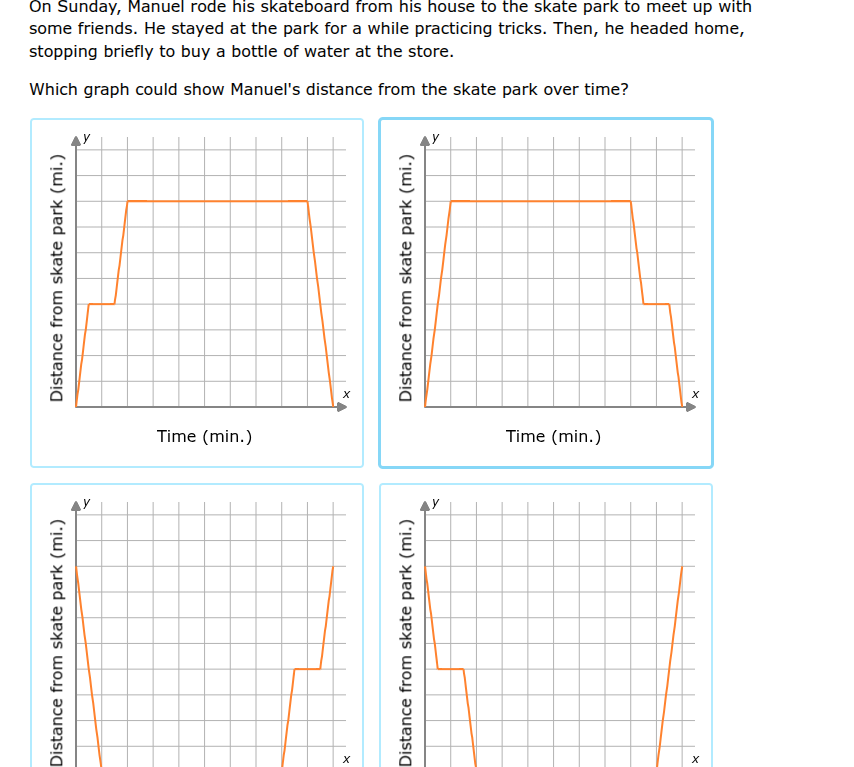
on sunday, manuel rode his skateboard from his house to the skate park to meet up with some friends. he stayed at the park for a while practicing tricks. then, he headed home, stopping briefly to buy a bottle of water at the store. which graph could show manuels distance from the skate park over time?
Brief Explanations
- Initial Distance: Manuel starts at his house, so his initial distance from the skate park should be some positive value (not zero). This eliminates the top - left and top - right graphs where the y - intercept (initial distance) is zero.
- Travel to Skate Park: As he rides to the skate park, his distance from the skate park should decrease. So the graph should have a decreasing segment at the beginning.
- Staying at Skate Park: When he stays at the park, his distance from the skate park remains constant (a horizontal line segment).
- Returning Home and Stopping at Store: When he heads home, his distance from the skate park starts to decrease again. But when he stops at the store, his distance from the skate park remains constant for a short time (another horizontal line segment) before decreasing to zero (when he reaches home).
- Final Check: The bottom - right graph starts with a positive initial distance (correct), has a decreasing segment (travel to park), a horizontal segment (staying at park), a decreasing segment (heading home), a short horizontal segment (stopping at store), and then a decreasing segment to zero (reaching home). The bottom - left graph has an incorrect pattern when returning home (the non - horizontal and non - decreasing segment at the end does not match the description).

Snap & solve any problem in the app
Get step-by-step solutions on Sovi AI
Photo-based solutions with guided steps
Explore more problems and detailed explanations
The bottom - right graph (the fourth graph)