QUESTION IMAGE
Question
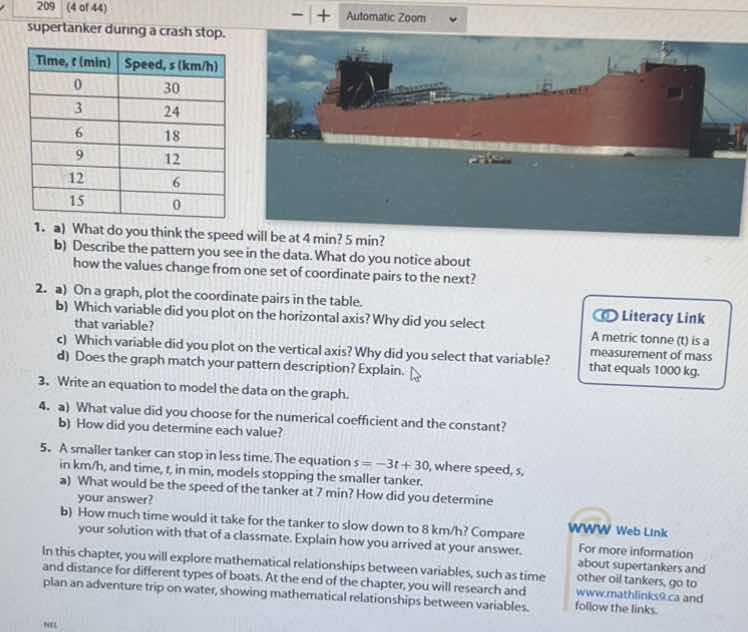
supertanker during a crash stop.
time, t (min) | speed, s (km/h)
--- | ---
0 | 30
3 | 24
6 | 18
9 | 12
12 | 6
15 | 0
- a) what do you think the speed will be at 4 min? 5 min?
b) describe the pattern you see in the data. what do you notice about how the values change from one set of coordinate pairs to the next?
- a) on a graph, plot the coordinate pairs in the table.
b) which variable did you plot on the horizontal axis? why did you select that variable?
c) which variable did you plot on the vertical axis? why did you select that variable?
d) does the graph match your pattern description? explain.
- write an equation to model the data on the graph.
- a) what value did you choose for the numerical coefficient and the constant?
b) how did you determine each value?
- a smaller tanker can stop in less time. the equation ( s = -3t + 30 ), where speed, ( s ), in km/h, and time, ( t ), in min, models the stopping of the smaller tanker.
a) what would be the speed of the tanker at 7 min? how did you determine your answer?
b) how much time would it take for the tanker to slow down to 8 km/h? compare your solution with that of a classmate. explain how you arrived at your answer.
in this chapter, you will explore mathematical relationships between variables, such as time and distance for different types of boats. at the end of the chapter, you will research and plan an adventure trip on water, showing mathematical relationships between variables.
literacy link
a metric tonne (t) is a measurement of mass that equals 1000 kg.
web link
for more information about supertankers and other oil tankers, go to www.mathlinks.ca and follow the links.
1. a)
Look at the pattern in the table: every 3 minutes, speed decreases by 6 km/h. That means each minute, speed drops by $\frac{6}{3}=2$ km/h.
- At t=3, speed is 24 km/h. At t=4 (1 minute later), speed = $24 - 2 = 22$ km/h.
- At t=5 (2 minutes after t=3), speed = $24 - (2*2) = 20$ km/h.
The pattern is a linear decrease: speed drops by 2 km/h every minute as time increases.
Plot the coordinate pairs (time, speed): (0,30), (3,24), (6,18), (9,12), (12,6), (15,0) on a graph, with each pair representing a point.
Time is the independent variable (it is controlled/elapses on its own, not dependent on speed), so it is placed on the horizontal axis.

Snap & solve any problem in the app
Get step-by-step solutions on Sovi AI
Photo-based solutions with guided steps
Explore more problems and detailed explanations
Speed at 4 min: 22 km/h; Speed at 5 min: 20 km/h. The speed decreases by 2 km/h for every 1 minute increase in time, showing a steady linear downward trend.
---