QUESTION IMAGE
Question
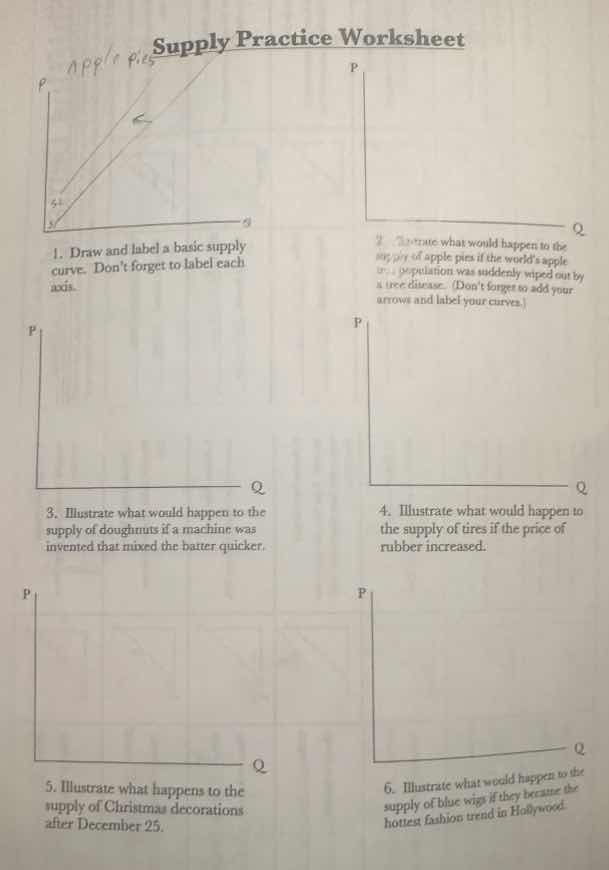
supply practice worksheet
- draw and label a basic supply curve. dont forget to label each axis.
- illustrate what would happen to the supply of apple pies if the worlds apple tree population was suddenly wiped out by a tree disease. (dont forget to add your arrows and label your curves.)
- illustrate what would happen to the supply of doughnuts if a machine was invented that mixed the batter quicker.
- illustrate what would happen to the supply of tires if the price of rubber increased.
- illustrate what happens to the supply of christmas decorations after december 25.
- illustrate what would happen to the supply of blue wigs if they became the hottest fashion trend in hollywood.
Question 1: Draw and label a basic supply curve. Don't forget to label each axis.
Step 1: Identify Axes
The supply curve has two axes: the vertical axis (Y - axis) represents Price (\( P \)) and the horizontal axis (X - axis) represents Quantity (\( Q \)).
Step 2: Draw the Supply Curve
A basic supply curve is an upward - sloping line. This is because, according to the law of supply, as the price of a good or service increases, the quantity supplied increases (ceteris paribus). Start from the origin or a point on the lower left. As you move up the price axis (increase in \( P \)), move to the right on the quantity axis (increase in \( Q \)). Label the vertical axis as "Price (\( P \))" and the horizontal axis as "Quantity (\( Q \))". Label the supply curve as \( S \).
Step 1: Determine the Change in Input
Apples are an input (raw material) for apple pies. If the apple population is wiped out, the cost of producing apple pies increases (because apples are more scarce or unavailable), and the quantity of apple pies that producers are willing and able to supply at each price level will decrease.
Step 2: Shift the Supply Curve
This is a decrease in supply, which is represented by a leftward shift of the supply curve. The original supply curve is \( S_1 \), and the new supply curve is \( S_2 \). Draw the original upward - sloping supply curve \( S_1 \). Then draw a new supply curve \( S_2 \) to the left of \( S_1 \). Add an arrow from \( S_1 \) to \( S_2 \) to show the shift. Label the vertical axis as "Price of Apple Pies (\( P \))" and the horizontal axis as "Quantity of Apple Pies (\( Q \))".
Step 1: Determine the Change in Technology
A new machine that mixes batter quicker is an improvement in technology. Improvements in technology reduce the cost of production (in this case, reduce the time and cost of mixing batter). As a result, producers are willing and able to supply more doughnuts at each price level.
Step 2: Shift the Supply Curve
This is an increase in supply, represented by a rightward shift of the supply curve. The original supply curve is \( S_1 \), and the new supply curve is \( S_2 \). Draw the original upward - sloping supply curve \( S_1 \). Then draw a new supply curve \( S_2 \) to the right of \( S_1 \). Add an arrow from \( S_1 \) to \( S_2 \) to show the shift. Label the vertical axis as "Price of Doughnuts (\( P \))" and the horizontal axis as "Quantity of Doughnuts (\( Q \))".

Snap & solve any problem in the app
Get step-by-step solutions on Sovi AI
Photo-based solutions with guided steps
Explore more problems and detailed explanations
The supply curve (\( S \)) is upward - sloping. The vertical axis is labeled "Price (\( P \))" and the horizontal axis is labeled "Quantity (\( Q \))".