QUESTION IMAGE
Question
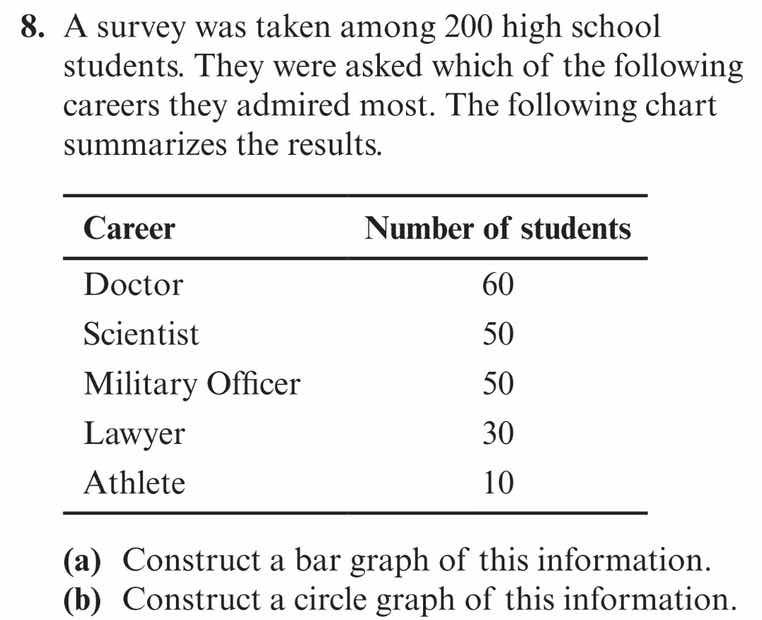
- a survey was taken among 200 high school students. they were asked which of the following careers they admired most. the following chart summarizes the results.
| career | number of students |
|---|---|
| scientist | 50 |
| military officer | 50 |
| lawyer | 30 |
| athlete | 10 |
(a) construct a bar graph of this information.
(b) construct a circle graph of this information.
Response
Part (a): Construct a Bar Graph
Step 1: Identify Axes and Categories
- X - axis (Horizontal Axis): Represents the different careers (Doctor, Scientist, Military Officer, Lawyer, Athlete).
- Y - axis (Vertical Axis): Represents the number of students. The range of the Y - axis should be from 0 to at least 60 (since the maximum number of students for a single career is 60).
Step 2: Draw the Bars
- For "Doctor", draw a bar that reaches up to 60 on the Y - axis.
- For "Scientist", draw a bar that reaches up to 50 on the Y - axis.
- For "Military Officer", draw a bar that reaches up to 50 on the Y - axis.
- For "Lawyer", draw a bar that reaches up to 30 on the Y - axis.
- For "Athlete", draw a bar that reaches up to 10 on the Y - axis.
Step 3: Label the Graph
- Title the bar graph: "Careers Admired Most by High School Students".
- Label the X - axis: "Career".
- Label the Y - axis: "Number of Students".
Part (b): Construct a Circle Graph (Pie Chart)
Step 1: Calculate the Total Number of Students
The total number of students surveyed is \(60 + 50+50 + 30+10=200\).
Step 2: Calculate the Percentage (and Central Angle) for Each Career
- Doctor:
- Percentage: \(\frac{60}{200}\times100 = 30\%\)
- Central Angle: \(0.3\times360^{\circ}=108^{\circ}\)
- Scientist:
- Percentage: \(\frac{50}{200}\times100 = 25\%\)
- Central Angle: \(0.25\times360^{\circ} = 90^{\circ}\)
- Military Officer:
- Percentage: \(\frac{50}{200}\times100=25\%\)
- Central Angle: \(0.25\times360^{\circ}=90^{\circ}\)
- Lawyer:
- Percentage: \(\frac{30}{200}\times100 = 15\%\)
- Central Angle: \(0.15\times360^{\circ}=54^{\circ}\)
- Athlete:
- Percentage: \(\frac{10}{200}\times100 = 5\%\)
- Central Angle: \(0.05\times360^{\circ}=18^{\circ}\)
Step 3: Draw the Pie Chart
- Draw a circle.
- Use a protractor to mark the central angles for each career:
- Draw a sector with a central angle of \(108^{\circ}\) for "Doctor".
- Draw two sectors with a central angle of \(90^{\circ}\) each for "Scientist" and "Military Officer".
- Draw a sector with a central angle of \(54^{\circ}\) for "Lawyer".
- Draw a sector with a central angle of \(18^{\circ}\) for "Athlete".
- Label each sector with the name of the career and its corresponding percentage.
- Title the pie chart: "Careers Admired Most by High School Students".
Final Answer (Summary of Construction)
- Bar Graph: Axes labeled, bars drawn to correct heights, and graph titled.
- Circle Graph: Sectors with correct central angles (based on percentages) drawn, labeled with careers and percentages, and graph titled.

Snap & solve any problem in the app
Get step-by-step solutions on Sovi AI
Photo-based solutions with guided steps
Explore more problems and detailed explanations
Part (a): Construct a Bar Graph
Step 1: Identify Axes and Categories
- X - axis (Horizontal Axis): Represents the different careers (Doctor, Scientist, Military Officer, Lawyer, Athlete).
- Y - axis (Vertical Axis): Represents the number of students. The range of the Y - axis should be from 0 to at least 60 (since the maximum number of students for a single career is 60).
Step 2: Draw the Bars
- For "Doctor", draw a bar that reaches up to 60 on the Y - axis.
- For "Scientist", draw a bar that reaches up to 50 on the Y - axis.
- For "Military Officer", draw a bar that reaches up to 50 on the Y - axis.
- For "Lawyer", draw a bar that reaches up to 30 on the Y - axis.
- For "Athlete", draw a bar that reaches up to 10 on the Y - axis.
Step 3: Label the Graph
- Title the bar graph: "Careers Admired Most by High School Students".
- Label the X - axis: "Career".
- Label the Y - axis: "Number of Students".
Part (b): Construct a Circle Graph (Pie Chart)
Step 1: Calculate the Total Number of Students
The total number of students surveyed is \(60 + 50+50 + 30+10=200\).
Step 2: Calculate the Percentage (and Central Angle) for Each Career
- Doctor:
- Percentage: \(\frac{60}{200}\times100 = 30\%\)
- Central Angle: \(0.3\times360^{\circ}=108^{\circ}\)
- Scientist:
- Percentage: \(\frac{50}{200}\times100 = 25\%\)
- Central Angle: \(0.25\times360^{\circ} = 90^{\circ}\)
- Military Officer:
- Percentage: \(\frac{50}{200}\times100=25\%\)
- Central Angle: \(0.25\times360^{\circ}=90^{\circ}\)
- Lawyer:
- Percentage: \(\frac{30}{200}\times100 = 15\%\)
- Central Angle: \(0.15\times360^{\circ}=54^{\circ}\)
- Athlete:
- Percentage: \(\frac{10}{200}\times100 = 5\%\)
- Central Angle: \(0.05\times360^{\circ}=18^{\circ}\)
Step 3: Draw the Pie Chart
- Draw a circle.
- Use a protractor to mark the central angles for each career:
- Draw a sector with a central angle of \(108^{\circ}\) for "Doctor".
- Draw two sectors with a central angle of \(90^{\circ}\) each for "Scientist" and "Military Officer".
- Draw a sector with a central angle of \(54^{\circ}\) for "Lawyer".
- Draw a sector with a central angle of \(18^{\circ}\) for "Athlete".
- Label each sector with the name of the career and its corresponding percentage.
- Title the pie chart: "Careers Admired Most by High School Students".
Final Answer (Summary of Construction)
- Bar Graph: Axes labeled, bars drawn to correct heights, and graph titled.
- Circle Graph: Sectors with correct central angles (based on percentages) drawn, labeled with careers and percentages, and graph titled.