QUESTION IMAGE
Question
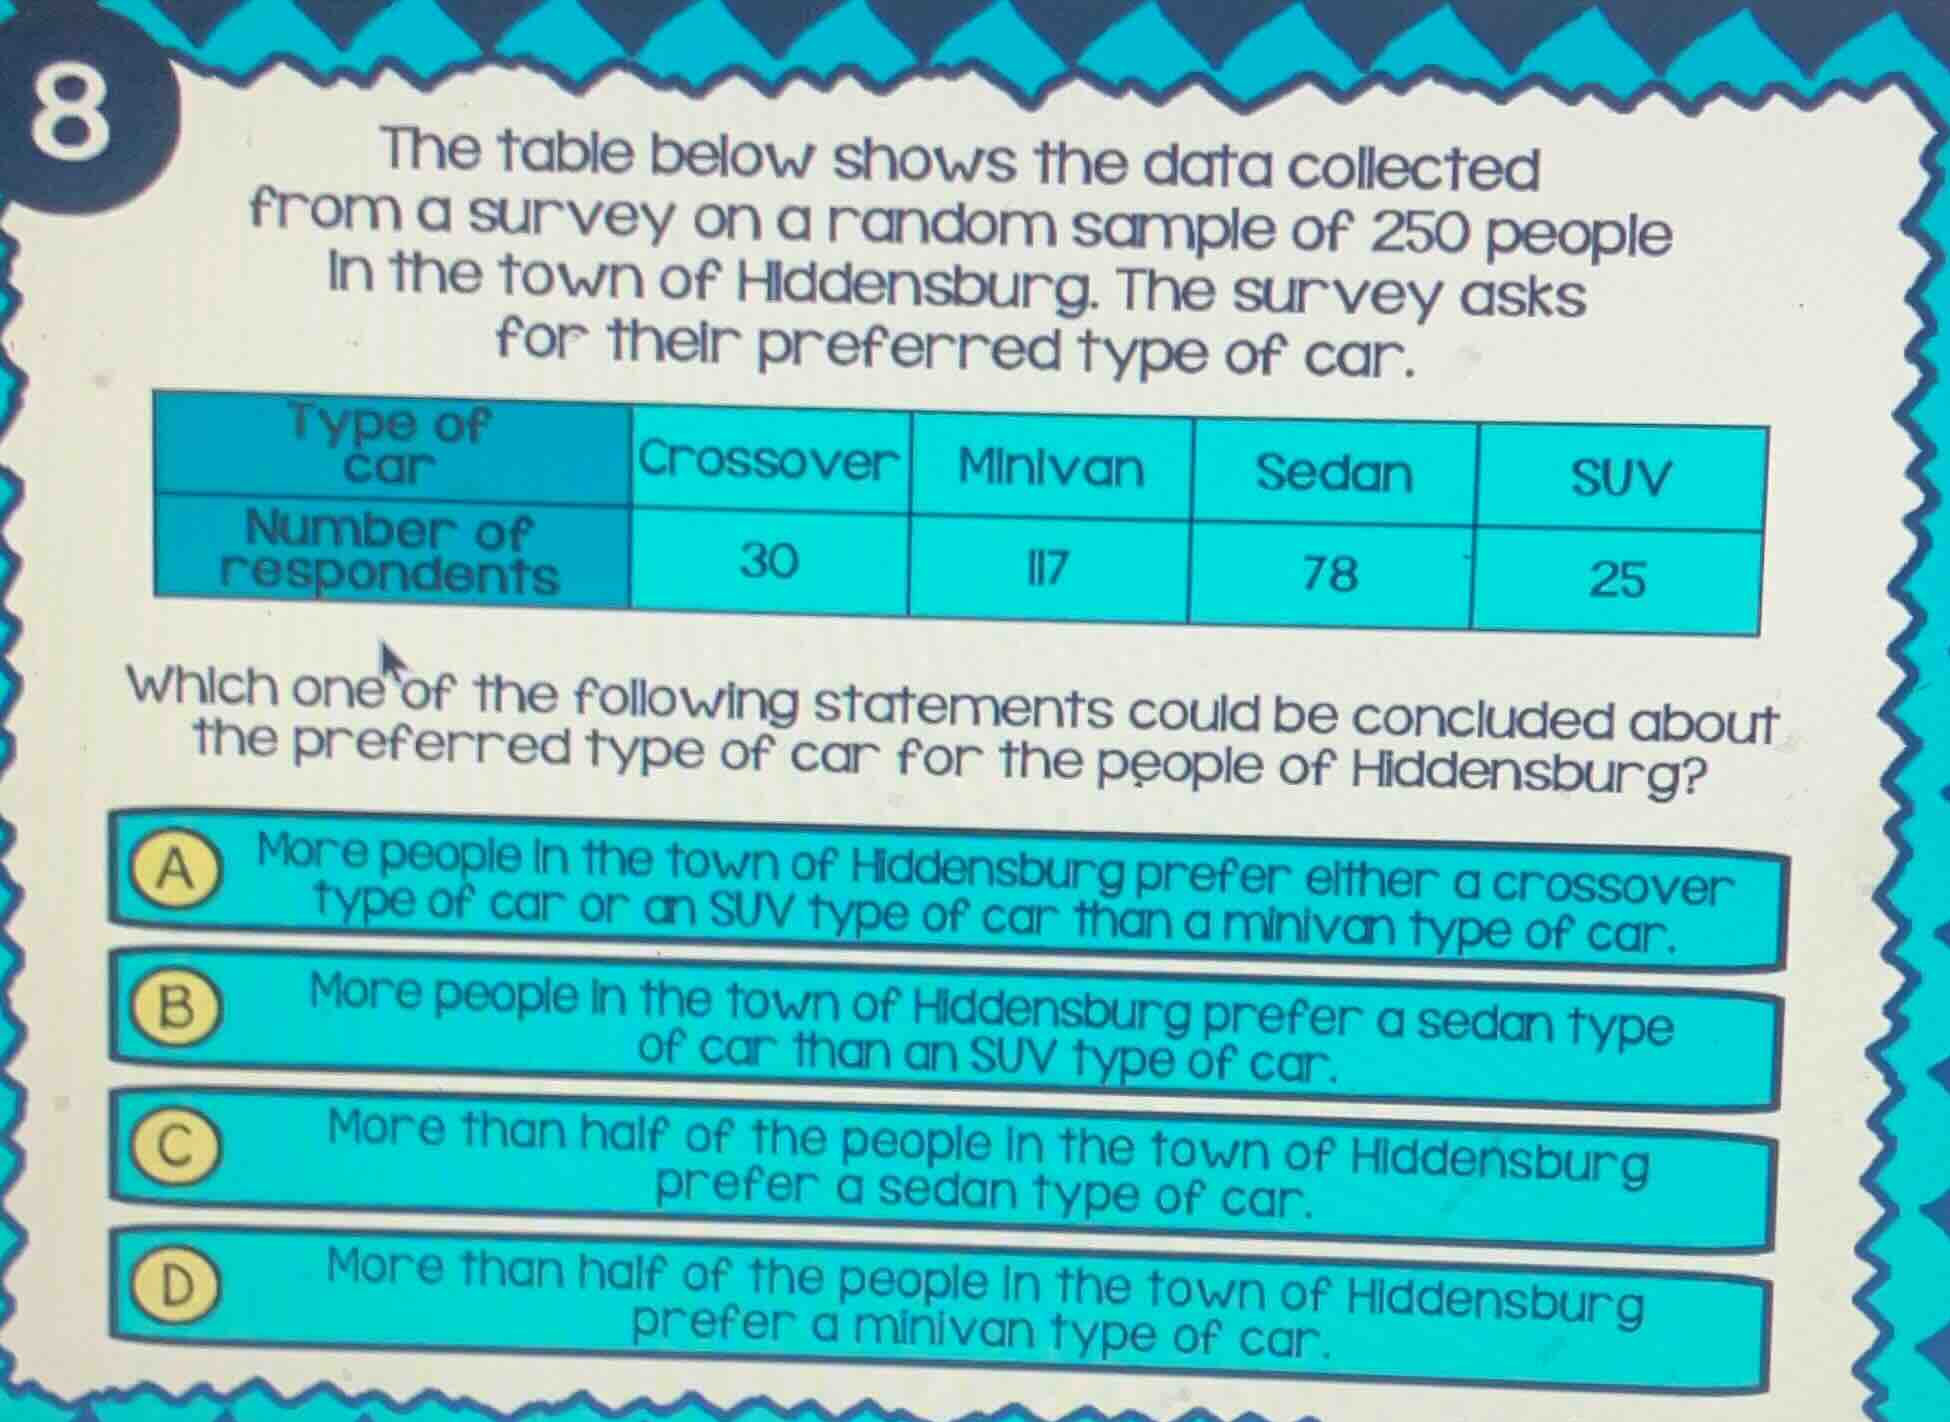
the table below shows the data collected from a survey on a random sample of 250 people in the town of hiddensburg. the survey asks for their preferred type of car.
type of car | crossover | minlvan | sedan | suv
number of respondents | 30 | 117 | 78 | 25
which one of the following statements could be concluded about the preferred type of car for the people of hiddensburg?
a more people in the town of hiddensburg prefer either a crossover type of car or an suv type of car than a minivan type of car.
b more people in the town of hiddensburg prefer a sedan type of car than an suv type of car.
c more than half of the people in the town of hiddensburg prefer a sedan type of car.
d more than half of the people in the town of hiddensburg prefer a minivan type of car.
Step1: Calculate total of Crossover+SUV
$30 + 25 = 55$
Step2: Compare to Minivan count
$55 < 117$, so A is false.
Step3: Compare Sedan and SUV counts
$78 > 25$, so B is true.
Step4: Check half of total respondents
$\frac{250}{2} = 125$
Step5: Compare to Sedan count
$78 < 125$, so C is false.
Step6: Compare to Minivan count
$117 < 125$, so D is false.

Snap & solve any problem in the app
Get step-by-step solutions on Sovi AI
Photo-based solutions with guided steps
Explore more problems and detailed explanations
B. More people in the town of Hiddensburg prefer a sedan type of car than an SUV type of car.