QUESTION IMAGE
Question
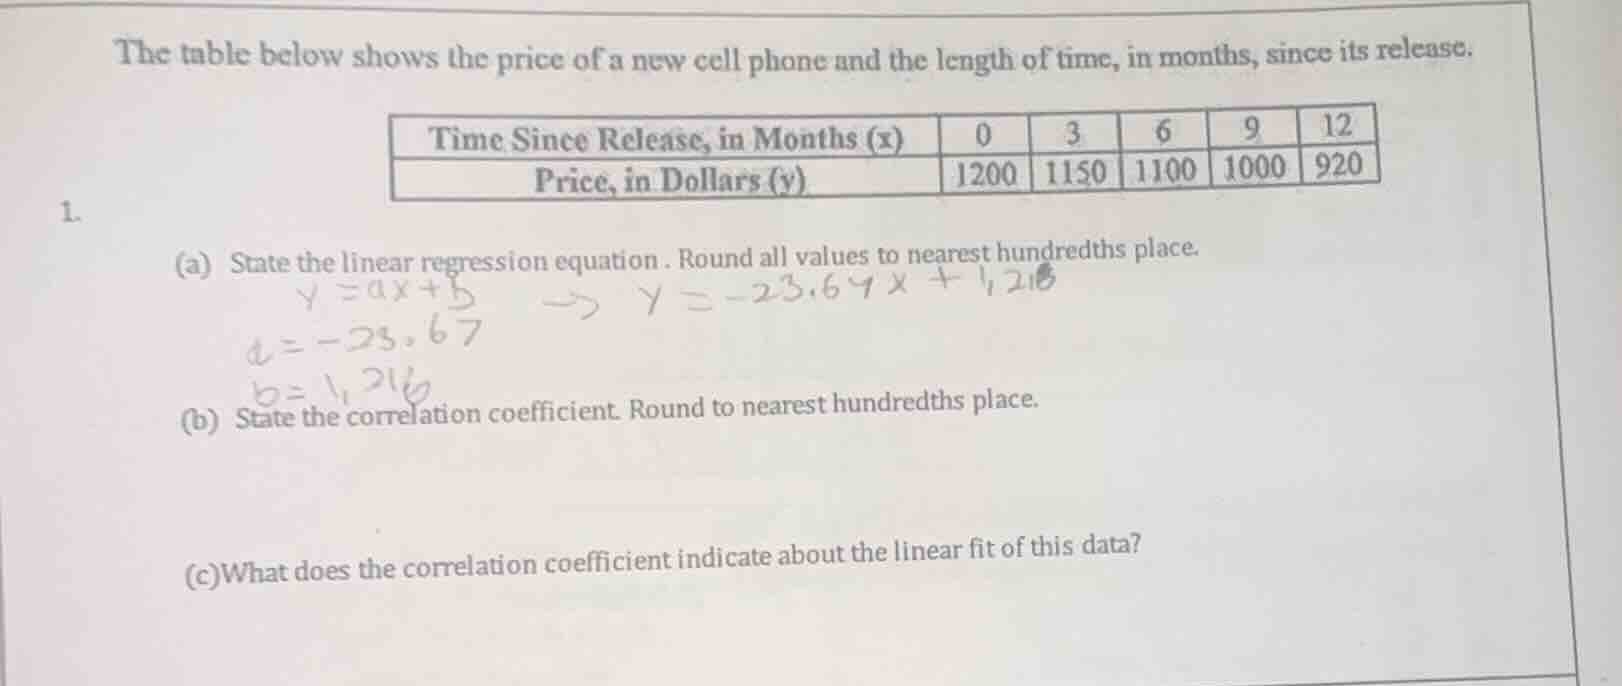
the table below shows the price of a new cell phone and the length of time, in months, since its release.
| time since release, in months (x) | 0 | 3 | 6 | 9 | 12 |
|---|
1.
(a) state the linear regression equation. round all values to nearest hundredths place.
(b) state the correlation coefficient. round to nearest hundredths place.
(c) what does the correlation coefficient indicate about the linear fit of this data?
Step1: Calculate key sums for regression
First, list the data points:
$(x_1,y_1)=(0,1200), (x_2,y_2)=(3,1150), (x_3,y_3)=(6,1100), (x_4,y_4)=(9,1000), (x_5,y_5)=(12,920)$
Compute sums:
$n=5$
$\sum x = 0+3+6+9+12=30$
$\sum y = 1200+1150+1100+1000+920=5370$
$\sum xy = (0×1200)+(3×1150)+(6×1100)+(9×1000)+(12×920)=0+3450+6600+9000+11040=30090$
$\sum x^2 = 0^2+3^2+6^2+9^2+12^2=0+9+36+81+144=270$
$\sum y^2 = 1200^2+1150^2+1100^2+1000^2+920^2=1440000+1322500+1210000+1000000+846400=5818900$
Step2: Calculate slope ($a$)
Use slope formula:
$a=\frac{n\sum xy - \sum x \sum y}{n\sum x^2 - (\sum x)^2}$
$a=\frac{5×30090 - 30×5370}{5×270 - 30^2}=\frac{150450 - 161100}{1350 - 900}=\frac{-10650}{450}≈-23.67$
Step3: Calculate y-intercept ($b$)
Use intercept formula:
$b=\frac{\sum y - a\sum x}{n}$
$b=\frac{5370 - (-23.67)×30}{5}=\frac{5370 + 710.1}{5}=\frac{6080.1}{5}=1216.02$
Linear regression equation: $\hat{y} = -23.67x + 1216.02$
Step4: Calculate correlation coefficient ($r$)
Use correlation formula:
$r=\frac{n\sum xy - \sum x \sum y}{\sqrt{[n\sum x^2 - (\sum x)^2][n\sum y^2 - (\sum y)^2]}}$
First compute denominator terms:
$n\sum y^2 - (\sum y)^2=5×5818900 - 5370^2=29094500 - 28836900=257600$
$[n\sum x^2 - (\sum x)^2][n\sum y^2 - (\sum y)^2]=450×257600=115920000$
$\sqrt{115920000}≈10766.61$
$r=\frac{-10650}{10766.61}≈-0.99$
Step5: Interpret correlation coefficient
A $r$ value close to -1 indicates a strong negative linear relationship.

Snap & solve any problem in the app
Get step-by-step solutions on Sovi AI
Photo-based solutions with guided steps
Explore more problems and detailed explanations
(a) $\hat{y} = -23.67x + 1216.02$
(b) $-0.99$
(c) The correlation coefficient indicates a very strong negative linear fit between time since release and the phone's price; as time increases, price decreases in a nearly perfectly linear pattern.