QUESTION IMAGE
Question
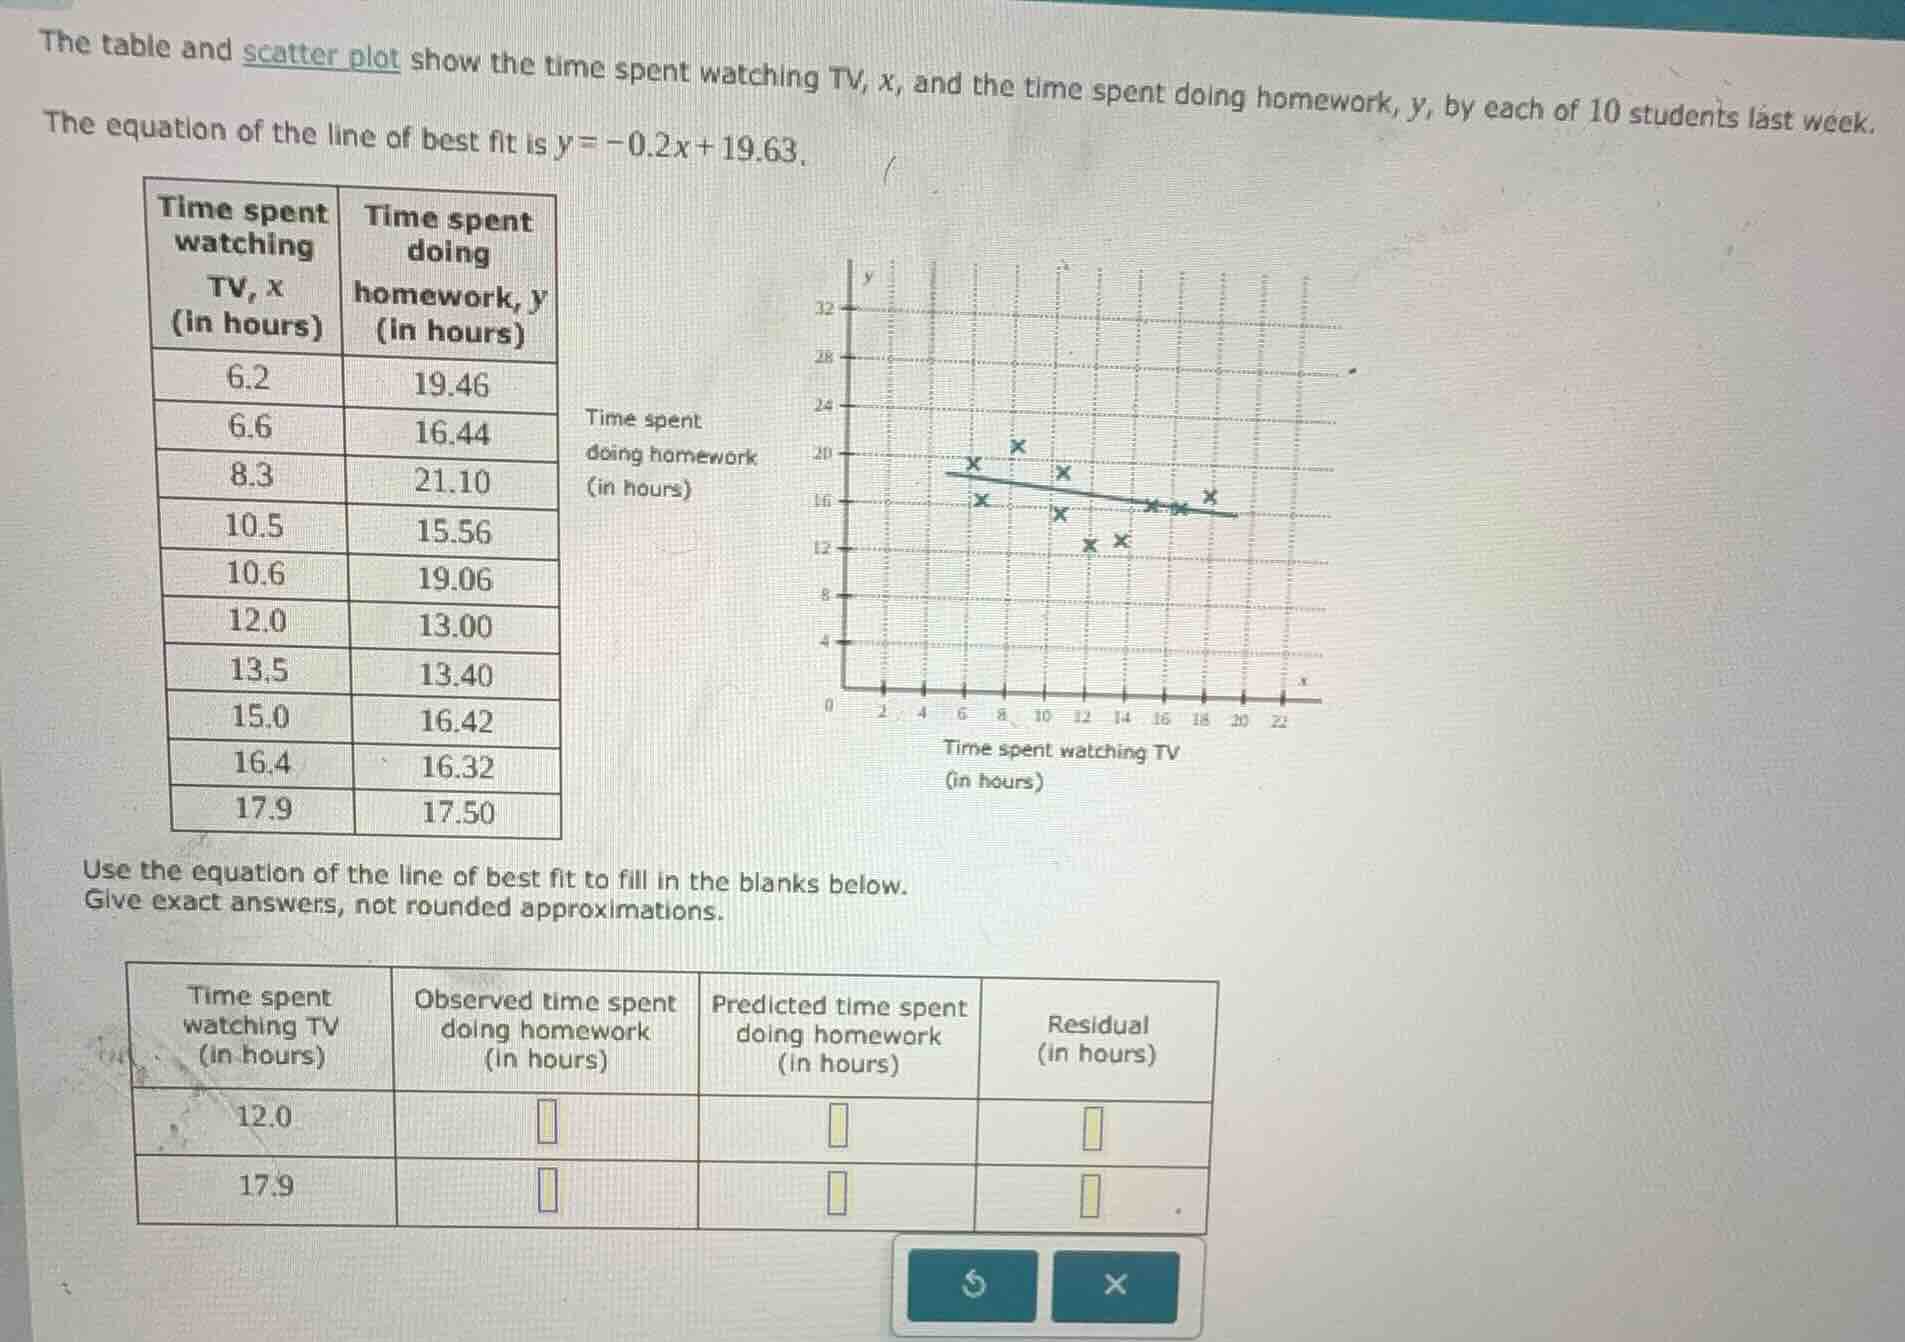
the table and scatter plot show the time spent watching tv, x, and the time spent doing homework, y, by each of 10 students last week. the equation of the line of best fit is $y = -0.2x + 19.63$. \
(scatter plot: x - axis time spent watching tv (in hours), y - axis time spent doing homework (in hours), with data points plotted) use the equation of the line of best fit to fill in the blanks below. give exact answers, not rounded approximations. \
Step1: Get observed y for x=12.0
From the first table, when $x=12.0$, observed $y=13.00$.
Step2: Calculate predicted y for x=12.0
Substitute $x=12.0$ into $y=-0.2x+19.63$:
$y=-0.2(12.0)+19.63 = -2.4 + 19.63 = 17.23$
Step3: Calculate residual for x=12.0
Residual = Observed - Predicted:
$13.00 - 17.23 = -4.23$
Step4: Get observed y for x=17.9
From the first table, when $x=17.9$, observed $y=17.50$.
Step5: Calculate predicted y for x=17.9
Substitute $x=17.9$ into $y=-0.2x+19.63$:
$y=-0.2(17.9)+19.63 = -3.58 + 19.63 = 16.05$
Step6: Calculate residual for x=17.9
Residual = Observed - Predicted:
$17.50 - 16.05 = 1.45$

Snap & solve any problem in the app
Get step-by-step solutions on Sovi AI
Photo-based solutions with guided steps
Explore more problems and detailed explanations
| Time spent watching TV (in hours) | Observed time spent doing homework (in hours) | Predicted time spent doing homework (in hours) | Residual (in hours) |
|---|---|---|---|
| 17.9 | 17.50 | 16.05 | 1.45 |