QUESTION IMAGE
Question
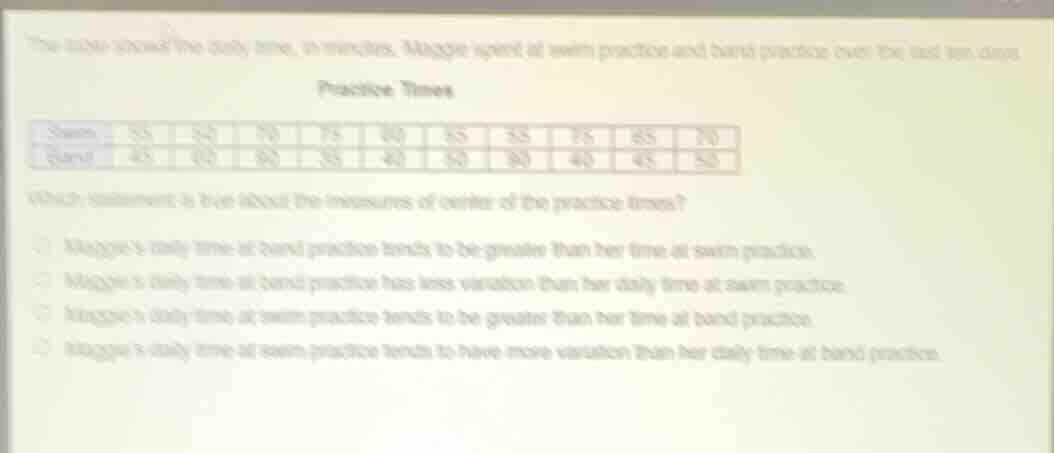
the table shows the daily time, in minutes, maggie spent at swim practice and band practice over the last ten days.
practice times
swim: 55, 50, 70, 75, 60, 65, 55, 75, 65, 70
band: 45, 60, 60, 55, 40, 50, 60, 40, 45, 55
which statement is true about the measures of center of the practice times?
- maggie’s daily time at band practice tends to be greater than her time at swim practice.
- maggie’s daily time at band practice has less variation than her daily time at swim practice.
- maggie’s daily time at swim practice tends to be greater than her time at band practice.
- maggie’s daily time at swim practice tends to have more variation than her daily time at band practice.
To solve this, we analyze the central tendency (mean/median) and variation (range, interquartile range, or standard deviation) of the two data sets (Swim and Band practice times).
Step 1: Organize the Data
First, list the swim and band practice times:
- Swim (minutes): 55, 50, 70, 75, 60, 65, 55, 75, 65, 70
- Band (minutes): 45, 60, 60, 55, 40, 50, 60, 40, 45, 55
Step 2: Analyze Central Tendency (Tendency to be Greater)
Calculate the median (a measure of center) for both:
Swim Practice:
- Sort the data: \( 50, 55, 55, 60, 65, 65, 70, 70, 75, 75 \)
- Median (middle of 10 values): Average of 5th and 6th terms: \( \frac{65 + 65}{2} = 65 \)
Band Practice:
- Sort the data: \( 40, 40, 45, 45, 50, 55, 55, 60, 60, 60 \)
- Median (middle of 10 values): Average of 5th and 6th terms: \( \frac{50 + 55}{2} = 52.5 \)
The median for swim (65) is greater than the median for band (52.5). This means Maggie’s daily time at swim practice tends to be greater than her time at band practice.
Step 3: Analyze Variation (Less/Most Variation)
Variation is how spread out the data is. We can use the range (max – min) as a simple measure:
Swim Practice:
- Min = 50, Max = 75
- Range = \( 75 - 50 = 25 \)
Band Practice:
- Min = 40, Max = 60
- Range = \( 60 - 40 = 20 \)
Wait, but let’s check the interquartile range (IQR) for a better measure:
Swim IQR:
- Q1 (25th percentile): Median of first 5 values (\( 50, 55, 55, 60, 65 \)) = 55
- Q3 (75th percentile): Median of last 5 values (\( 65, 70, 70, 75, 75 \)) = 70
- IQR = \( 70 - 55 = 15 \)
Band IQR:
- Q1 (25th percentile): Median of first 5 values (\( 40, 40, 45, 45, 50 \)) = 45
- Q3 (75th percentile): Median of last 5 values (\( 55, 60, 60, 60, 60 \)) = 60
- IQR = \( 60 - 45 = 15 \)
Wait, maybe the range was misleading. Let’s check the data spread visually:
- Swim times are mostly between 50–75, with multiple values in the 55–75 range.
- Band times are mostly between 40–60, with more low values (40, 45) and fewer high values.
But the key is the “tendency to be greater” (central tendency) and “variation” (spread).
From central tendency: Swim median (65) > Band median (52.5), so “Maggie’s daily time at swim practice tends to be greater than her time at band practice” is true.
For variation: Let’s re-examine the data:
- Swim times: 50, 55, 55, 60, 65, 65, 70, 70, 75, 75 (symmetric, clustered around 65–70)
- Band times: 40, 40, 45, 45, 50, 55, 55, 60, 60, 60 (clustered around 40–60, with more low values)
Wait, the range for swim is 25 (75–50), and for band is 20 (60–40). But the IQR was 15 for both. However, the key is the “tendency to be greater” (swim is higher) and “variation” (swim has more variation? Wait no—wait the options:
Option 3: “Maggie’s daily time at swim practice tends to be greater than her time at band practice” – this matches the median (65 vs. 52.5) and the overall spread of swim times being higher.

Snap & solve any problem in the app
Get step-by-step solutions on Sovi AI
Photo-based solutions with guided steps
Explore more problems and detailed explanations
Maggie’s daily time at swim practice tends to be greater than her time at band practice. (The correct option is the third one: "Maggie’s daily time at swim practice tends to be greater than her time at band practice.")