QUESTION IMAGE
Question
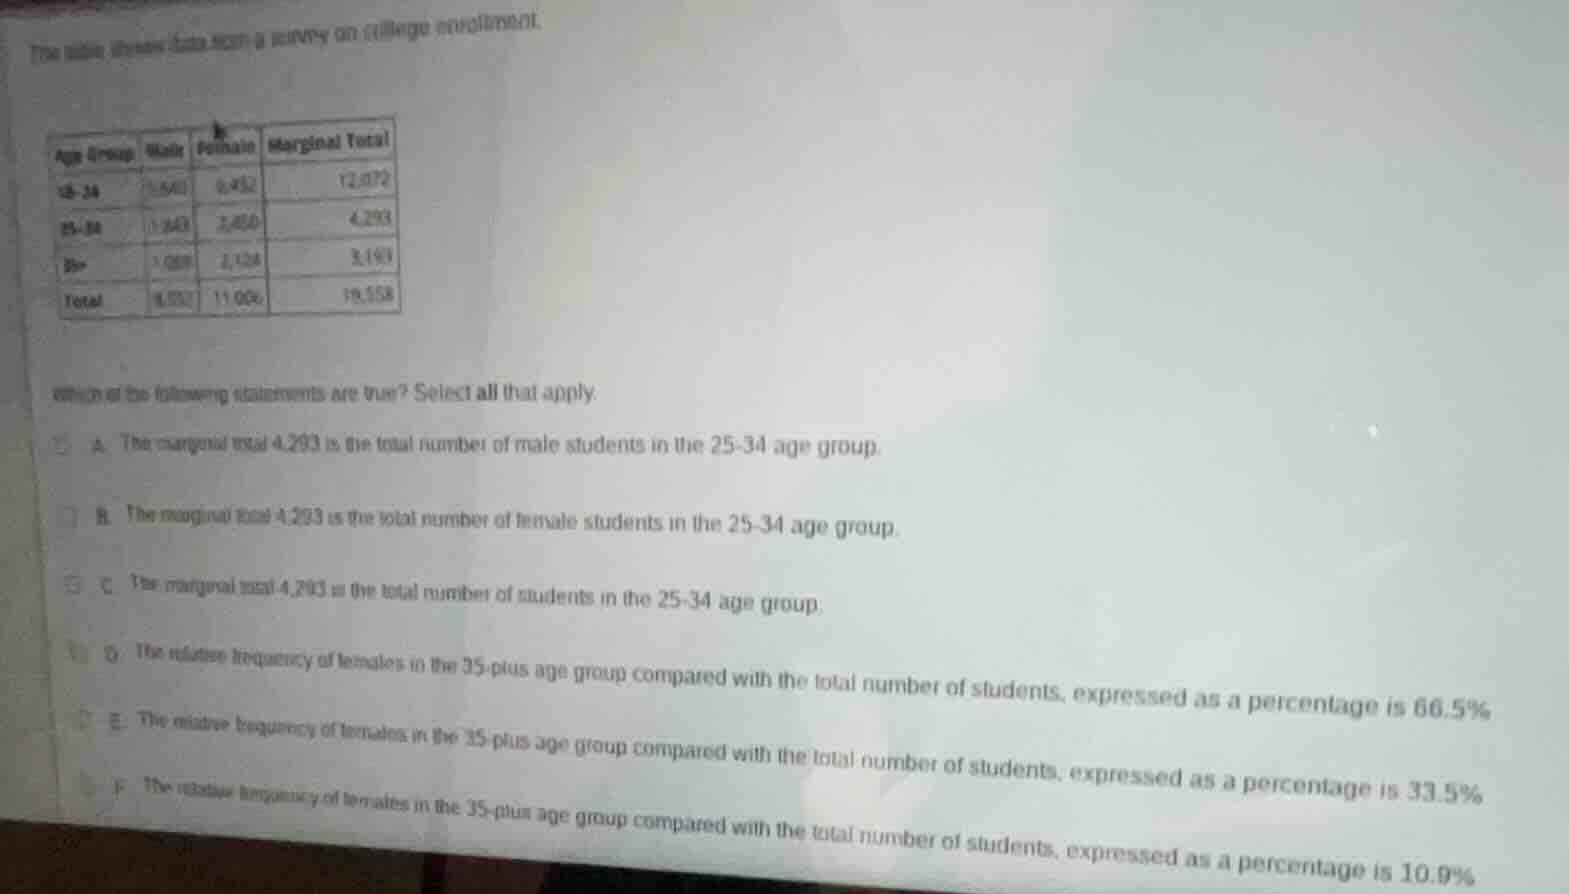
the table shows data from a survey on college enrollment.
| age group | male | female | marginal total |
|---|---|---|---|
| 25 - 34 | 1453 | 2840 | 4293 |
| 35+ | 1999 | 1193 | 3192 |
| total | 8093 | 11064 | 19158 |
which of the following statements are true? select all that apply.
a. the marginal total 4293 is the total number of male students in the 25 - 34 age group.
b. the marginal total 4293 is the total number of female students in the 25 - 34 age group.
c. the marginal total 4293 is the total number of students in the 25 - 34 age group.
d. the relative frequency of females in the 35 - plus age group compared with the total number of students, expressed as a percentage is 66.5%
e. the relative frequency of females in the 35 - plus age group compared with the total number of students, expressed as a percentage is 33.5%
f. the relative frequency of females in the 35 - plus age group compared with the total number of students, expressed as a percentage is 10.0%
Step1: Analyze marginal total for 25-34
The marginal total for a row is the sum of male and female students in that age group. For 25-34: $1643 + 2650 = 4293$, so it is the total students in this group.
Step2: Calculate relative frequency for 35+ females
First, identify the number of females in 35+ age group: 2104. Total students: 19558.
Relative frequency percentage: $\frac{2104}{19558} \times 100\% \approx 10.8\% \approx 10.9\%$

Snap & solve any problem in the app
Get step-by-step solutions on Sovi AI
Photo-based solutions with guided steps
Explore more problems and detailed explanations
C. The marginal total 4,293 is the total number of students in the 25-34 age group.
F. The relative frequency of females in the 35-plus age group compared with the total number of students, expressed as a percentage is 10.9%