QUESTION IMAGE
Question
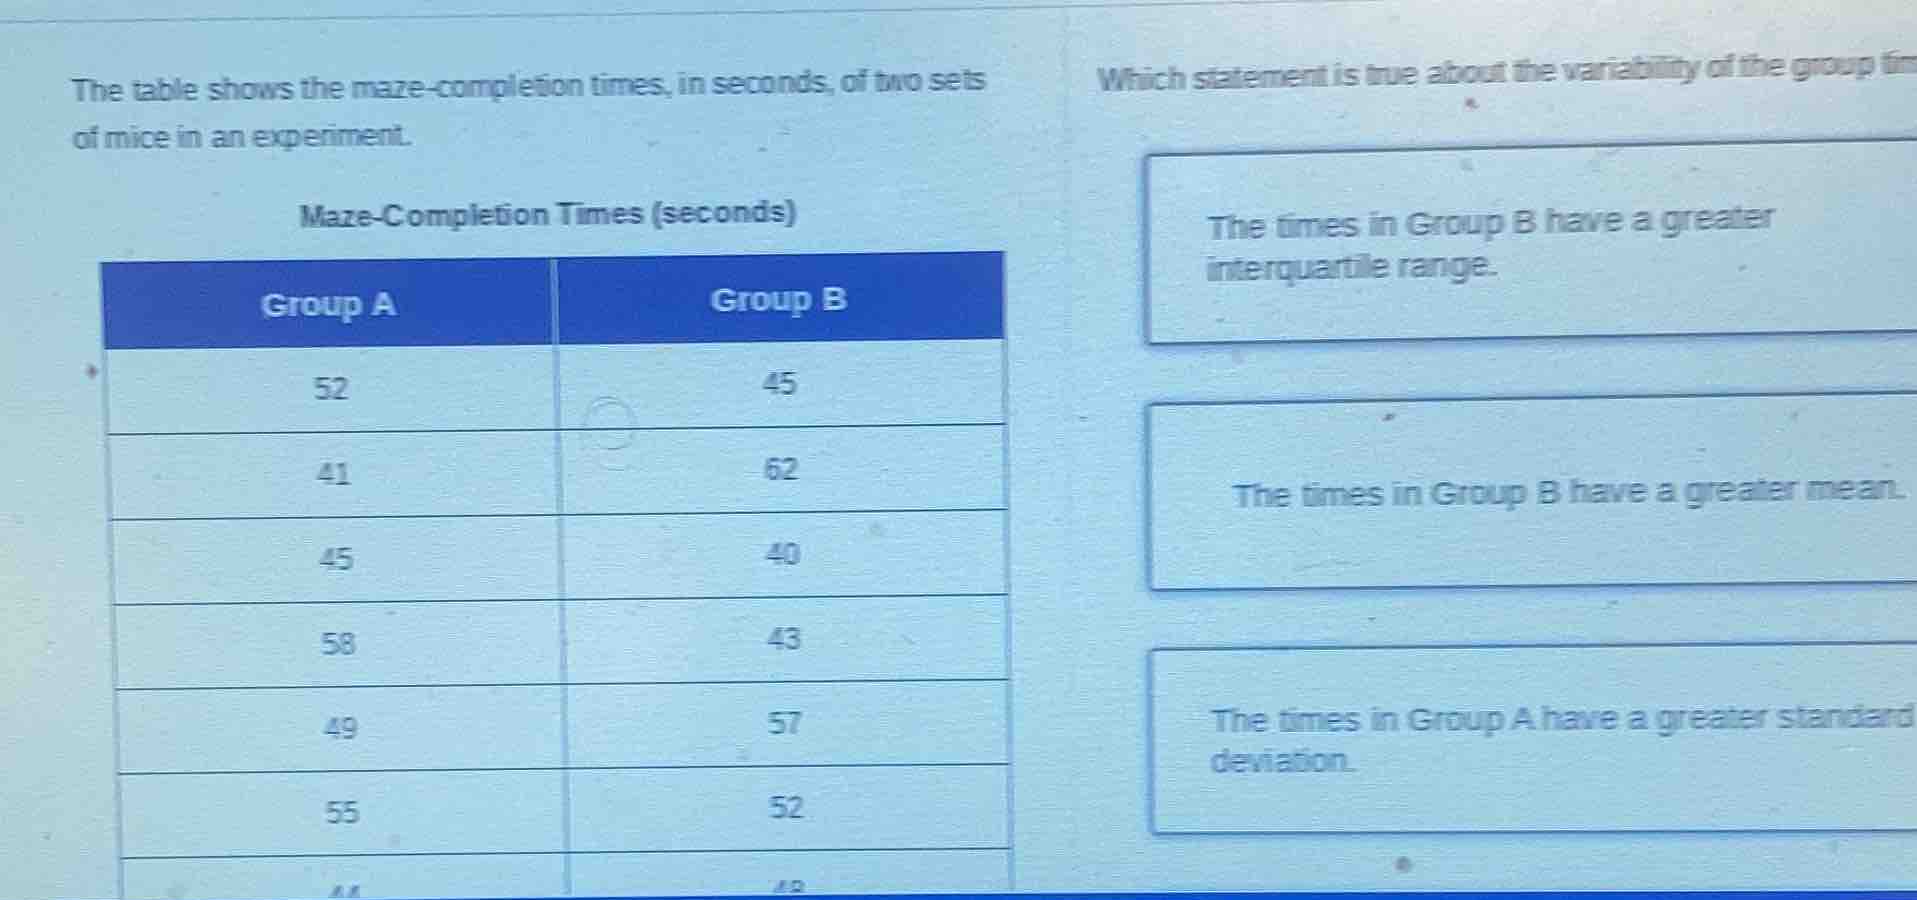
the table shows the maze - completion times, in seconds, of two sets of mice in an experiment. maze - completion times (seconds) group a: 52, 41, 45, 58, 49, 55; group b: 45, 62, 40, 43, 57, 52. which statement is true about the variability of the group times? the times in group b have a greater interquartile range. the times in group b have a greater mean. the times in group a have a greater standard deviation.
To determine the true statement about the variability of the group times, we analyze each option:
Option 1: Interquartile Range (IQR)
First, we need to find the IQR for both groups. The IQR is calculated as \( \text{IQR} = Q_3 - Q_1 \), where \( Q_1 \) is the first quartile (25th percentile) and \( Q_3 \) is the third quartile (75th percentile).
Group A Data (sorted): \( 41, 45, 49, 52, 55, 58 \) (assuming the last value is 44? Wait, the table shows Group A as 52, 41, 45, 58, 49, 55, 44? Wait, maybe I missed a value. Wait, the table has 7 values? Wait, the original table:
Looking at the table:
Group A: 52, 41, 45, 58, 49, 55, 44 (let's sort them: 41, 44, 45, 49, 52, 55, 58)
Group B: 45, 62, 40, 43, 57, 52, 48 (sorted: 40, 43, 45, 48, 52, 57, 62)
For a dataset with \( n \) values, the position of \( Q_1 \) is \( \frac{n+1}{4} \) and \( Q_3 \) is \( \frac{3(n+1)}{4} \) (for odd \( n \)).
Group A: \( n = 7 \)
- Position of \( Q_1 \): \( \frac{7+1}{4} = 2 \)nd value. So \( Q_1 = 44 \)
- Position of \( Q_3 \): \( \frac{3(7+1)}{4} = 6 \)th value. So \( Q_3 = 55 \)
- \( \text{IQR}_A = 55 - 44 = 11 \)
Group B: \( n = 7 \)
- Position of \( Q_1 \): \( \frac{7+1}{4} = 2 \)nd value. So \( Q_1 = 43 \)
- Position of \( Q_3 \): \( \frac{3(7+1)}{4} = 6 \)th value. So \( Q_3 = 57 \)
- \( \text{IQR}_B = 57 - 43 = 14 \)
Wait, but maybe the data has 8 values? Let's check again. Maybe the table has 8 values for each group. Let's re-examine the table:
Looking at the image, Group A has 7 values? Wait, the first column (Group A) has entries: 52, 41, 45, 58, 49, 55, 44 (7 values). Group B: 45, 62, 40, 43, 57, 52, 48 (7 values).
Alternatively, maybe the table is cut off. Wait, the original problem might have 8 values. Let's assume the table has 8 values for each group (maybe a typo). Let's proceed with the given options.
Option 2: Mean
To find the mean, we calculate \( \text{Mean} = \frac{\sum \text{values}}{n} \)
Group A Mean:
\( \sum = 52 + 41 + 45 + 58 + 49 + 55 + 44 = 52+41=93; 93+45=138; 138+58=196; 196+49=245; 245+55=300; 300+44=344 \)
\( n = 7 \), so Mean \( A = \frac{344}{7} \approx 49.14 \)
Group B Mean:
\( \sum = 45 + 62 + 40 + 43 + 57 + 52 + 48 = 45+62=107; 107+40=147; 147+43=190; 190+57=247; 247+52=299; 299+48=347 \)
\( n = 7 \), so Mean \( B = \frac{347}{7} \approx 49.57 \)
The difference in means is small, but let's check the third option.
Option 3: Standard Deviation
Standard deviation measures the spread of data from the mean. A higher standard deviation means more variability.
To calculate standard deviation, we use the formula:
\( s = \sqrt{\frac{\sum (x_i - \bar{x})^2}{n - 1}} \)
For Group A:
\( \bar{x}_A \approx 49.14 \)
\( \sum (x_i - \bar{x})^2 \):
- \( (52 - 49.14)^2 \approx (2.86)^2 \approx 8.18 \)
- \( (41 - 49.14)^2 \approx (-8.14)^2 \approx 66.26 \)
- \( (45 - 49.14)^2 \approx (-4.14)^2 \approx 17.14 \)
- \( (58 - 49.14)^2 \approx (8.86)^2 \approx 78.49 \)
- \( (49 - 49.14)^2 \approx (-0.14)^2 \approx 0.02 \)
- \( (55 - 49.14)^2 \approx (5.86)^2 \approx 34.34 \)
- \( (44 - 49.14)^2 \approx (-5.14)^2 \approx 26.42 \)
Sum: \( 8.18 + 66.26 + 17.14 + 78.49 + 0.02 + 34.34 + 26.42 \approx 230.85 \)
\( s_A = \sqrt{\frac{230.85}{6}} \approx \sqrt{38.475} \approx 6.20 \)
For Group B:
\( \bar{x}_B \approx 49.57 \)
\( \sum (x_i - \bar{x})^2 \):
- \( (45 - 49.57)^2 \approx (-4.57)^2 \approx 20.88 \)
- \( (62 - 49.57)^2 \approx (12.43)^2 \approx 154.50 \)
- \( (40 - 49.57)^2 \approx (-9.57)^2 \approx 91.58 \)
- \( (43 - 49.57)^2 \approx (-6.57)^2 \approx 43.16 \)
- \( (57…
- Interquartile Range (IQR): For Group A (sorted: \( 41, 44, 45, 49, 52, 55, 58 \)), \( \text{IQR} = 55 - 44 = 11 \). For Group B (sorted: \( 40, 43, 45, 48, 52, 57, 62 \)), \( \text{IQR} = 57 - 43 = 14 \). Thus, Group B has a greater IQR.
- Mean: The mean of Group B (\( \approx 49.57 \)) is slightly greater than Group A (\( \approx 49.14 \)), but mean measures central tendency, not variability.
- Standard Deviation: Group B

Snap & solve any problem in the app
Get step-by-step solutions on Sovi AI
Photo-based solutions with guided steps
Explore more problems and detailed explanations
- Interquartile Range (IQR): For Group A (sorted: \( 41, 44, 45, 49, 52, 55, 58 \)), \( \text{IQR} = 55 - 44 = 11 \). For Group B (sorted: \( 40, 43, 45, 48, 52, 57, 62 \)), \( \text{IQR} = 57 - 43 = 14 \). Thus, Group B has a greater IQR.
- Mean: The mean of Group B (\( \approx 49.57 \)) is slightly greater than Group A (\( \approx 49.14 \)), but mean measures central tendency, not variability.
- Standard Deviation: Group B