QUESTION IMAGE
Question
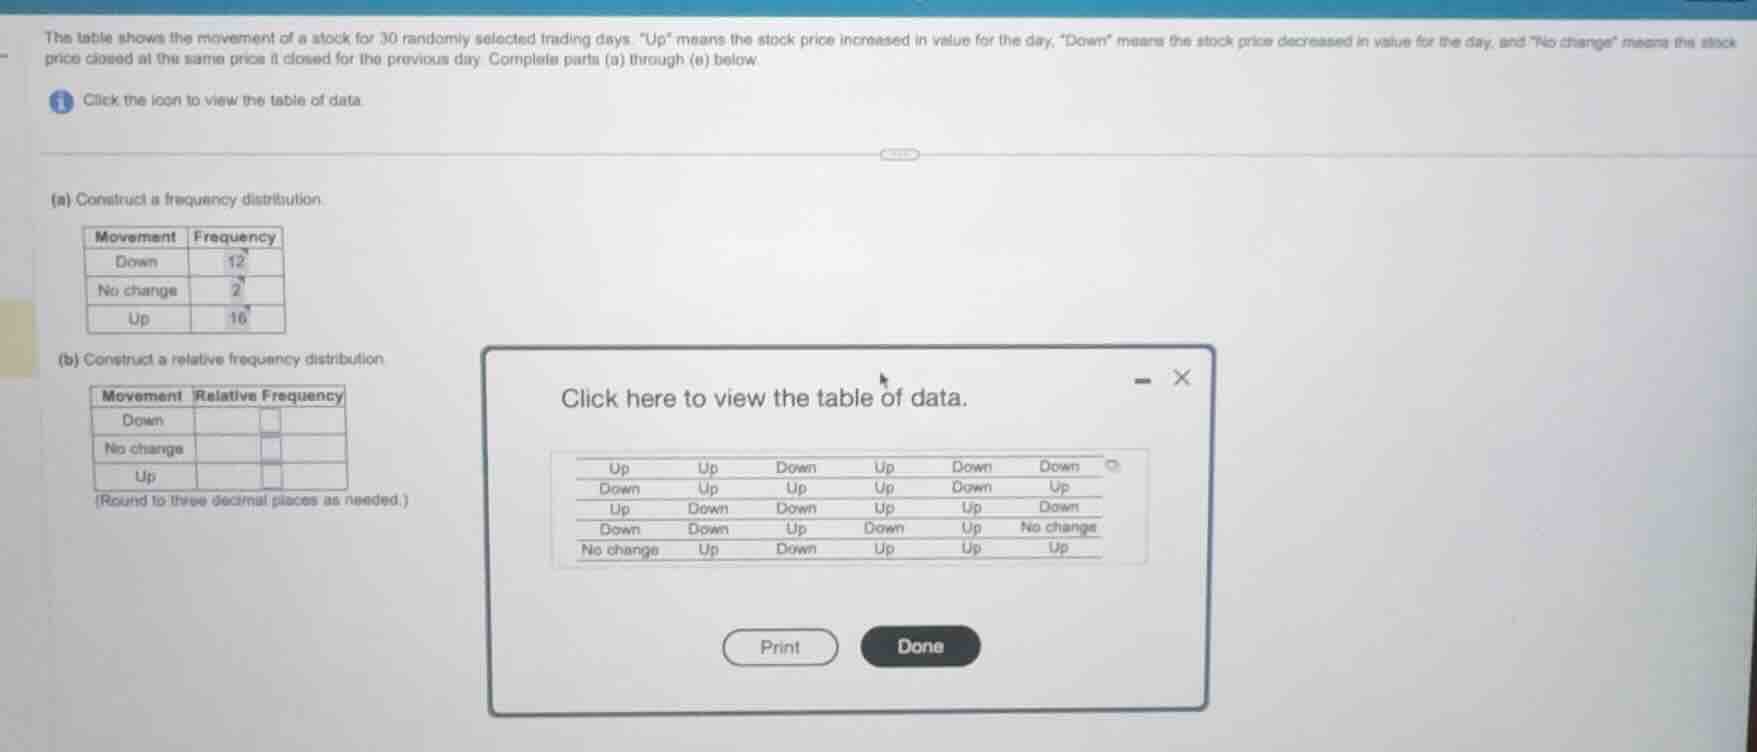
the table shows the movement of a stock for 30 randomly selected trading days. \up\ means the stock price increased in value for the day, \down\ means the stock price decreased in value for the day, and
o change\ means the stock price closed at the same price it closed for the previous day. complete parts (a) through (e) below.
click the icon to view the table of data.
(a) construct a frequency distribution.
| movement | frequency |
|---|---|
| no change | 2 |
| up | 16 |
(b) construct a relative frequency distribution.
| movement | relative frequency |
|---|---|
| no change | |
| up |
(round to three decimal places as needed.)
click here to view the table of data.
(the table of data is shown as: up, up, down, up, down, down; down, up, up, up, down, up; up, down, down, up, up, down; down, down, up, down, up, no change; no change, up, down, up, up, up)
Step1: Count total days
Total days = 30 (given)
Step2: Count "Down" frequency
Count all "Down" entries: 12 (matches given)
Step3: Count "No change" frequency
Count all "No change" entries: 2 (matches given)
Step4: Count "Up" frequency
Count all "Up" entries: 16 (matches given)
Step5: Calculate relative frequency for Down
Relative frequency = $\frac{\text{Frequency of Down}}{\text{Total Days}}$
$\frac{12}{30} = 0.400$
Step6: Calculate relative frequency for No change
Relative frequency = $\frac{\text{Frequency of No change}}{\text{Total Days}}$
$\frac{2}{30} \approx 0.067$
Step7: Calculate relative frequency for Up
Relative frequency = $\frac{\text{Frequency of Up}}{\text{Total Days}}$
$\frac{16}{30} \approx 0.533$

Snap & solve any problem in the app
Get step-by-step solutions on Sovi AI
Photo-based solutions with guided steps
Explore more problems and detailed explanations
(a) Frequency Distribution:
| Movement | Frequency |
|---|---|
| No change | 2 |
| Up | 16 |
(b) Relative Frequency Distribution:
| Movement | Relative Frequency |
|---|---|
| No change | 0.067 |
| Up | 0.533 |