QUESTION IMAGE
Question
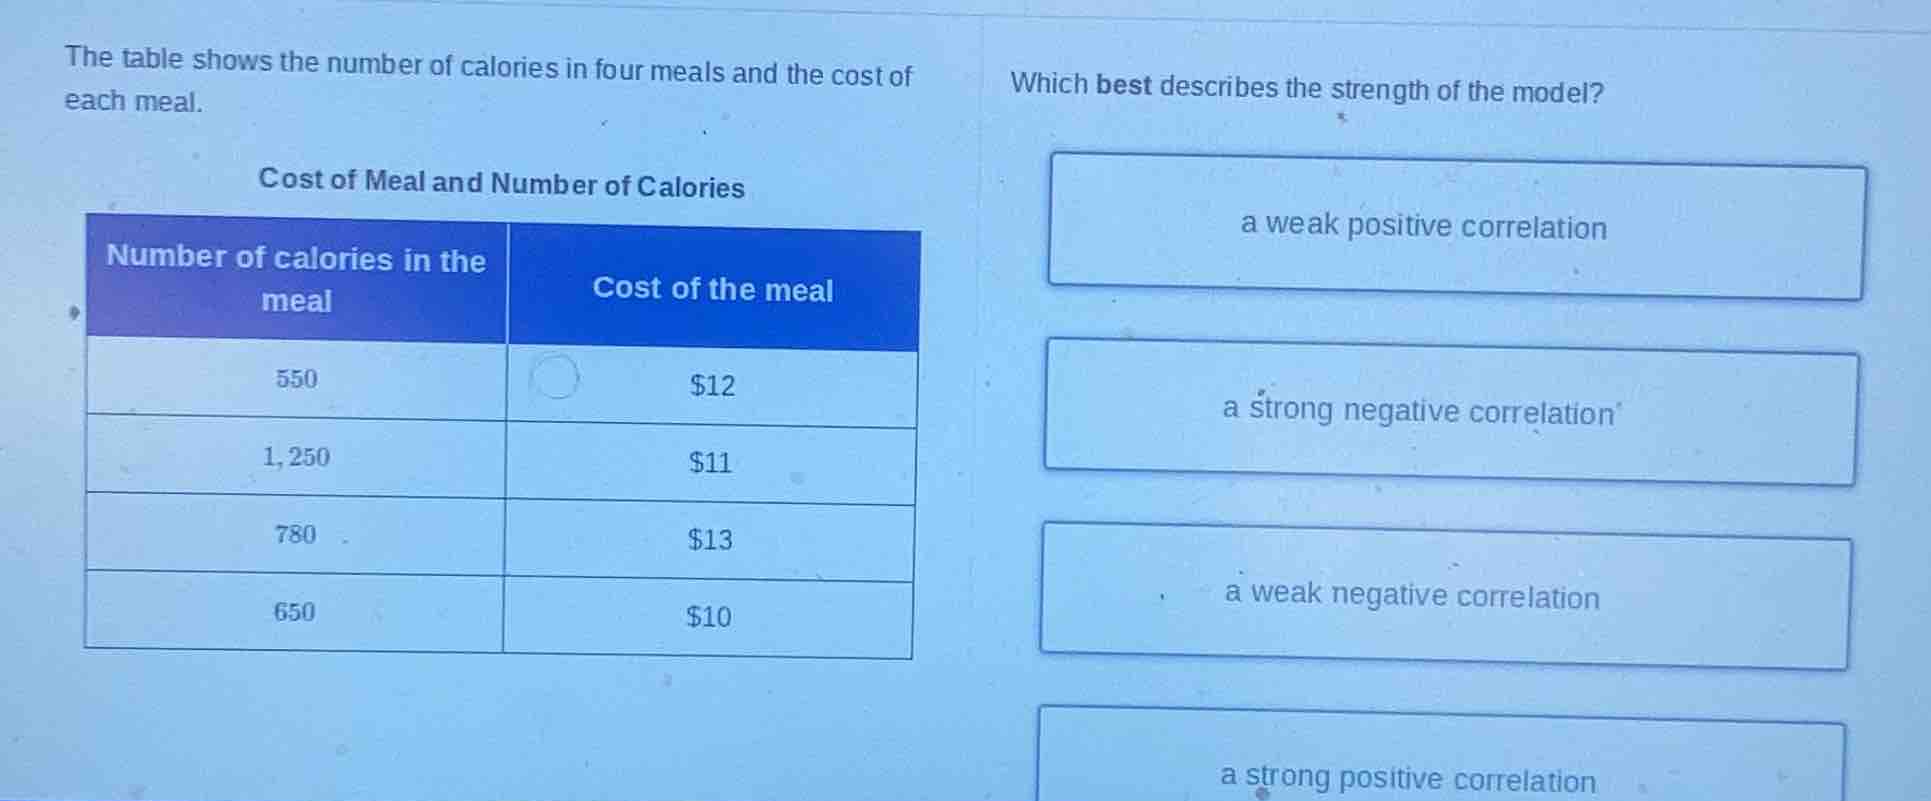
the table shows the number of calories in four meals and the cost of each meal. cost of meal and number of calories number of calories in the meal cost of the meal 550 $12 1,250 $11 780 $13 650 $10 which best describes the strength of the model? a weak positive correlation a strong negative correlation a weak negative correlation a strong positive correlation
To determine the correlation, we analyze the relationship between calories (x - variable) and cost (y - variable). Let's list the pairs: (550, 12), (1250, 11), (780, 13), (650, 10). As calories increase, cost doesn't show a strong upward or downward trend. The direction of the correlation (if we calculate the correlation coefficient or observe the scatter - plot trend) is negative (since as calories increase, cost sometimes decreases and sometimes increases but the overall trend is slightly negative), and the relationship is not strong (the points are not tightly clustered around a line). So it's a weak negative correlation.

Snap & solve any problem in the app
Get step-by-step solutions on Sovi AI
Photo-based solutions with guided steps
Explore more problems and detailed explanations
a weak negative correlation