QUESTION IMAGE
Question
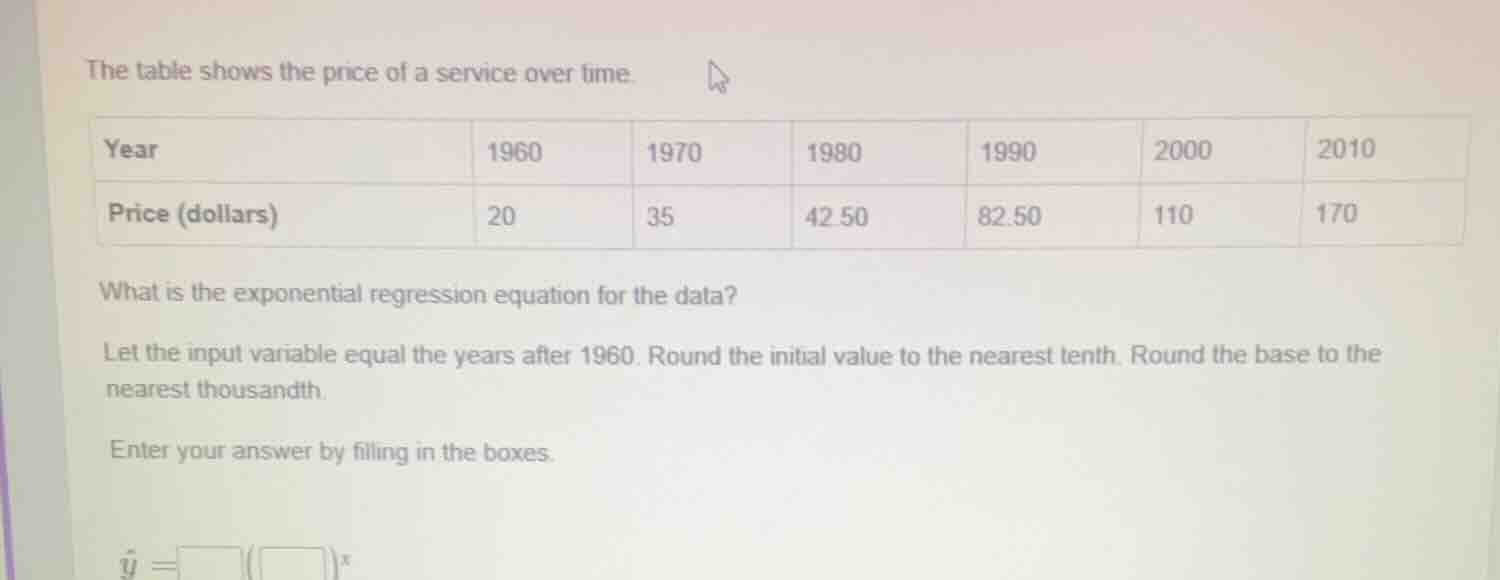
the table shows the price of a service over time.
year | 1960 | 1970 | 1980 | 1990 | 2000 | 2010
price (dollars) | 20 | 35 | 42.50 | 82.50 | 110 | 170
what is the exponential regression equation for the data?
let the input variable equal the years after 1960. round the initial value to the nearest tenth. round the base to the nearest thousandth.
enter your answer by filling in the boxes.
$hat{y} = square (square)^x$
Step1: Define input variable $x$
Let $x$ = years after 1960. So the $x$-values are: 0, 10, 20, 30, 40, 50, paired with $y$-values: 20, 35, 42.50, 82.50, 110, 170.
Step2: Recall exponential regression form
The exponential regression equation is $\hat{y} = ab^x$, where $a$ is the initial value, $b$ is the growth base.
Step3: Calculate $a$ and $b$
Using a calculator or statistical tool for exponential regression on the $(x,y)$ pairs:
- The initial value $a$ (when $x=0$) rounds to 20.9
- The base $b$ rounds to 1.059

Snap & solve any problem in the app
Get step-by-step solutions on Sovi AI
Photo-based solutions with guided steps
Explore more problems and detailed explanations
$\hat{y} = 20.9(1.059)^x$