QUESTION IMAGE
Question
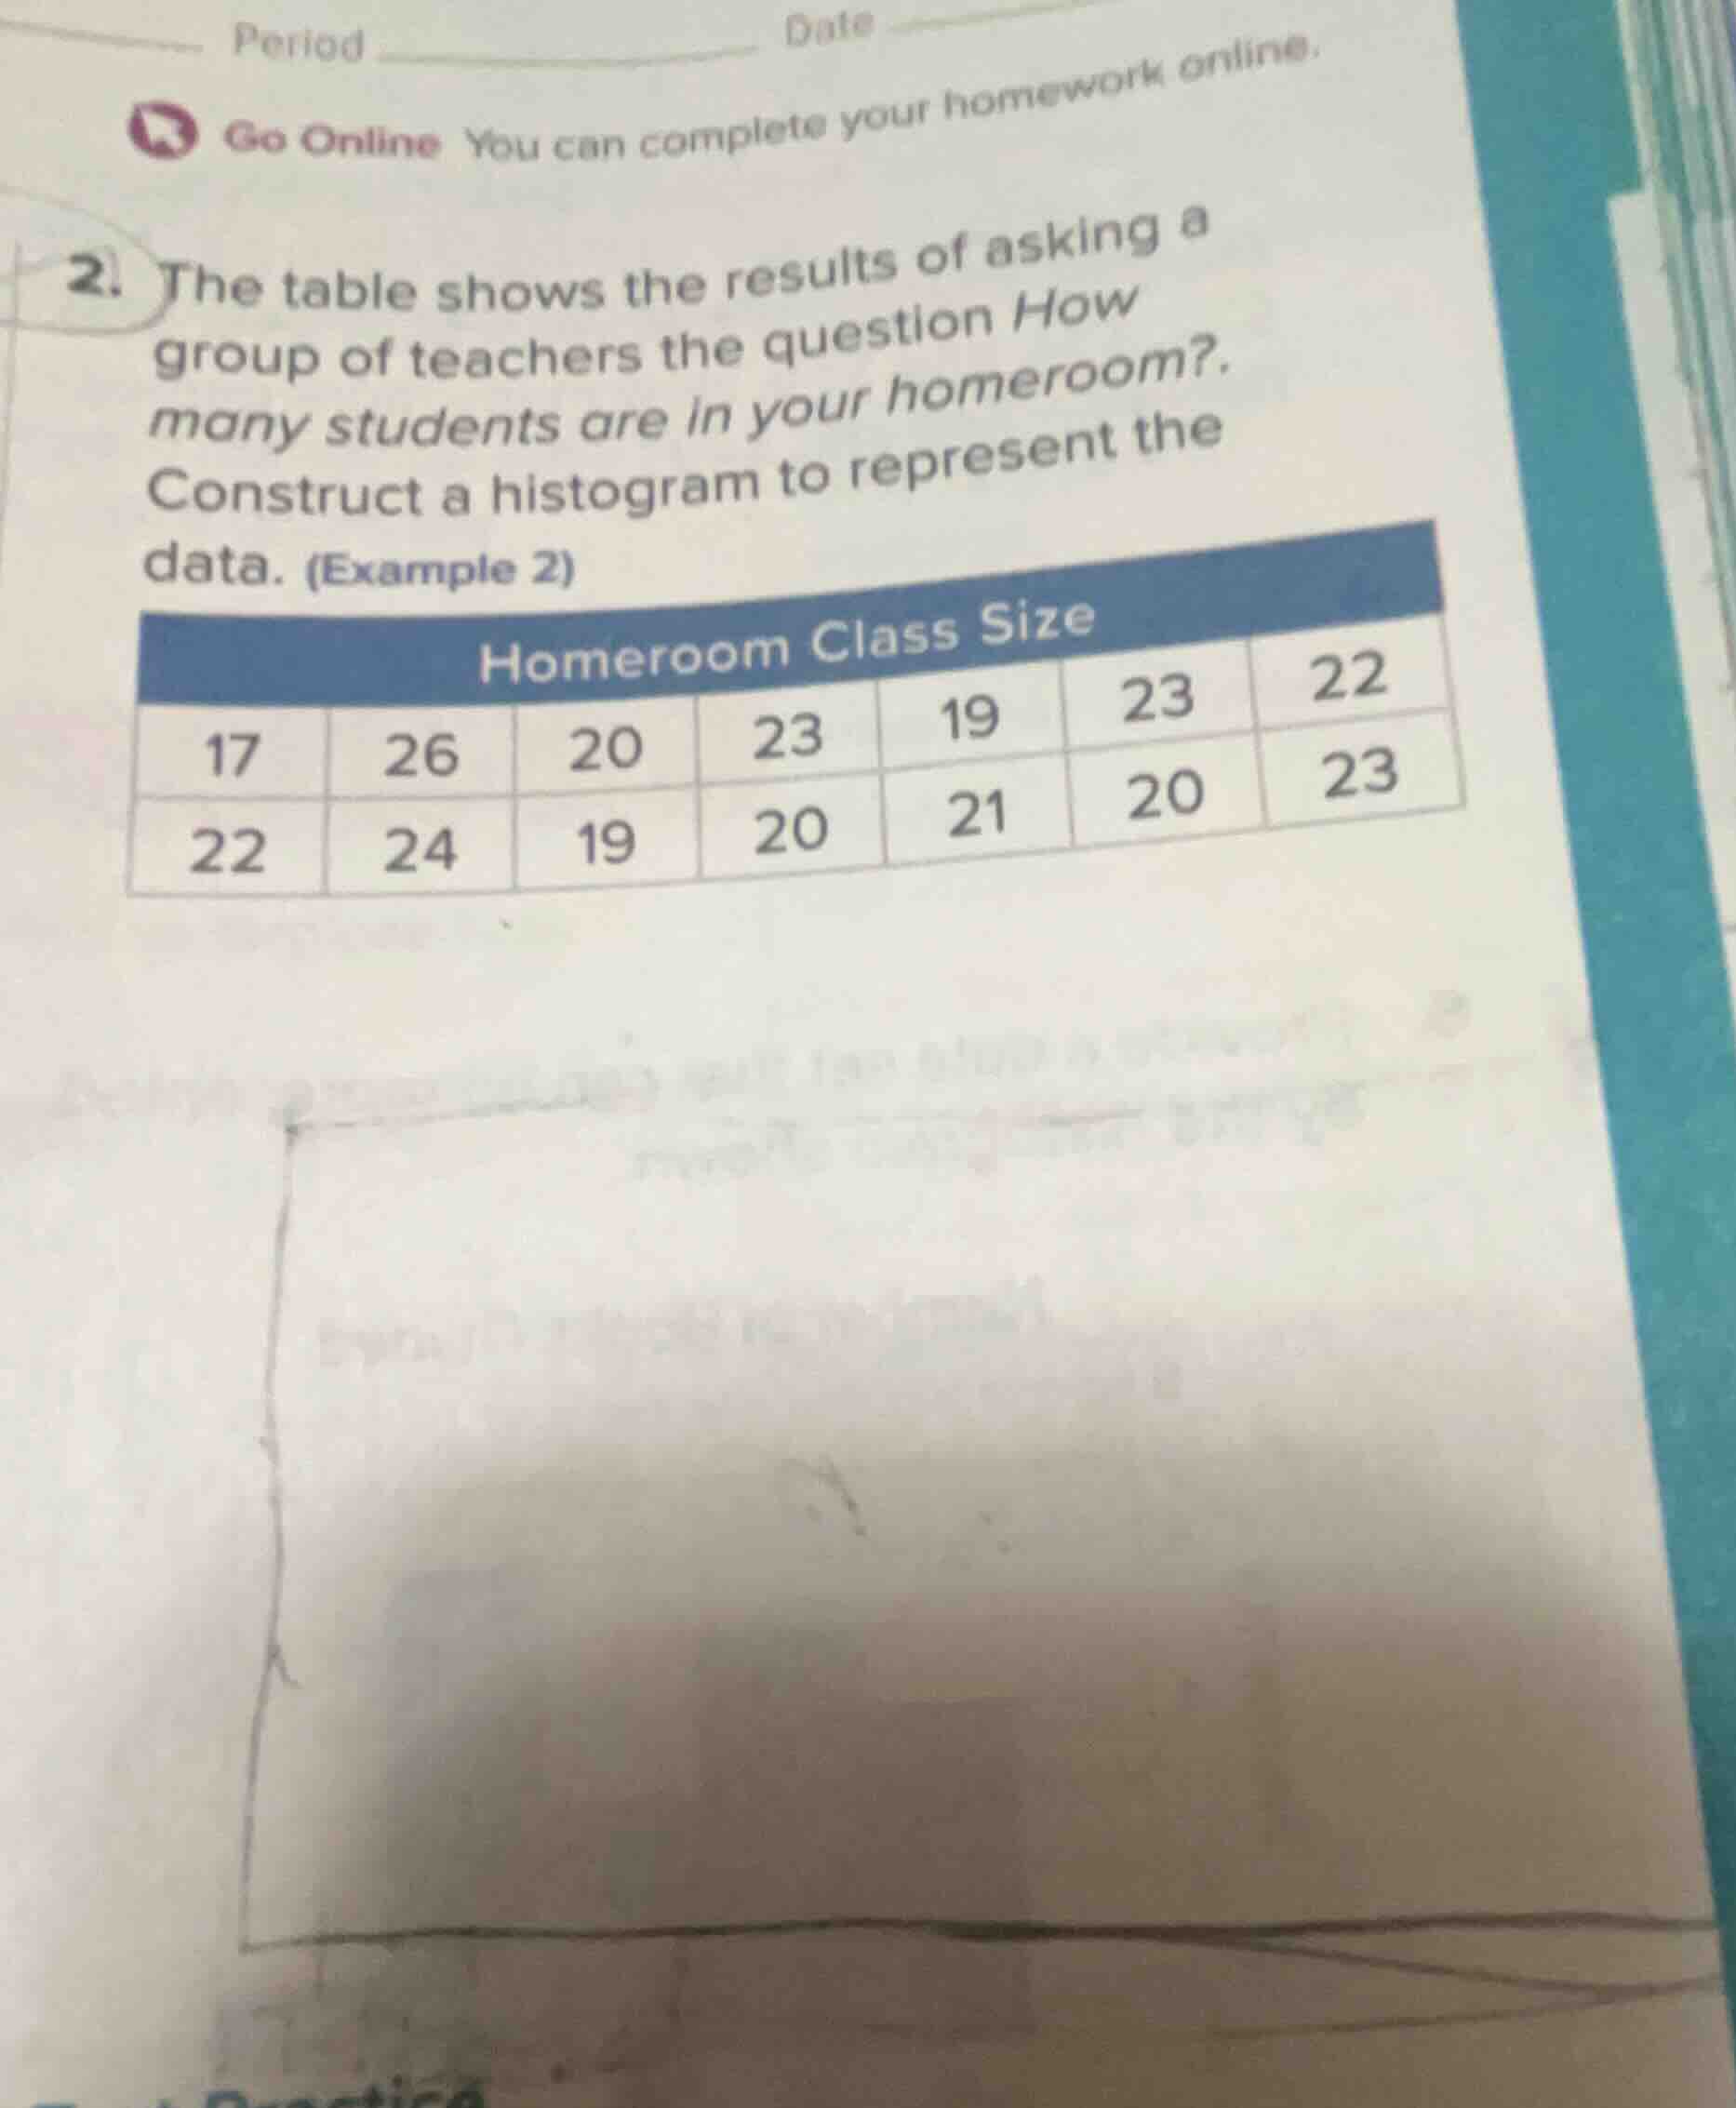
- the table shows the results of asking a group of teachers the question how many students are in your homeroom?. construct a histogram to represent the data. (example 2) homeroom class size 17 26 20 23 19 23 22 22 24 19 20 21 20 23
Step1: Sort the data values
Sorted data: 17, 19, 19, 20, 20, 20, 21, 22, 22, 23, 23, 23, 24, 26
Step2: Choose equal class intervals
Class intervals (width 3): 17-19, 20-22, 23-25, 26-28
Step3: Tally frequencies per interval
- 17-19: 17,19,19 → Frequency = 3
- 20-22: 20,20,20,21,22,22 → Frequency = 6
- 23-25: 23,23,23,24 → Frequency = 4
- 26-28: 26 → Frequency = 1
Step4: Define histogram axes
X-axis: Homeroom Class Size (intervals), Y-axis: Frequency

Snap & solve any problem in the app
Get step-by-step solutions on Sovi AI
Photo-based solutions with guided steps
Explore more problems and detailed explanations
| Homeroom Class Size Interval | Frequency |
|---|---|
| 20-22 | 6 |
| 23-25 | 4 |
| 26-28 | 1 |
To draw the histogram:
- Mark the x-axis with the intervals 17-19, 20-22, 23-25, 26-28.
- Mark the y-axis with frequency values from 0 to 6.
- Draw a bar for each interval with height equal to its corresponding frequency (3, 6, 4, 1 respectively), with no gaps between bars.