QUESTION IMAGE
Question
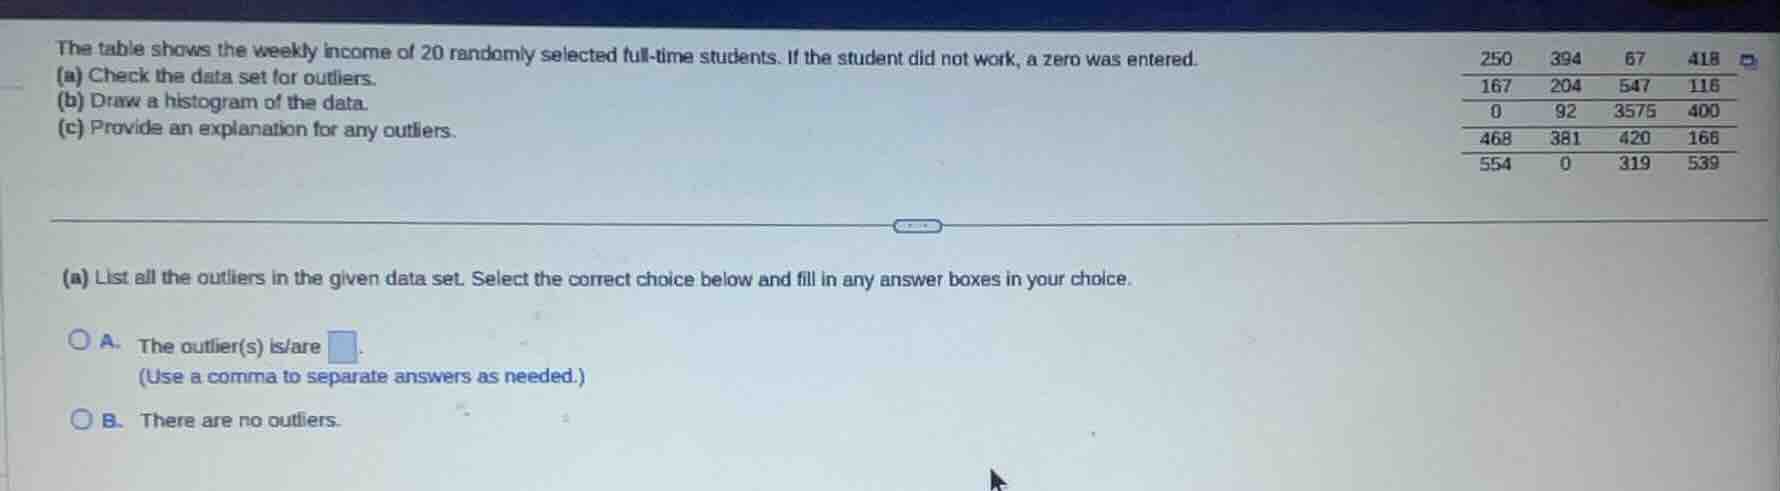
the table shows the weekly income of 20 randomly selected full-time students. if the student did not work, a zero was entered.250 394 67 418167 204 547 1160 92 3575 400468 381 420 166554 0 319 539(a) check the data set for outliers.(b) draw a histogram of the data.(c) provide an explanation for any outliers.(a) list all the outliers in the given data set. select the correct choice below and fill in any answer boxes in your choice.a. the outlier(s) is/are .(use a comma to separate answers as needed.)b. there are no outliers.
Step1: Arrange data in order
$0, 0, 67, 92, 116, 166, 167, 204, 250, 319, 381, 394, 400, 418, 420, 468, 539, 547, 554, 3575$
Step2: Find median (Q2)
Median is average of 10th & 11th values:
$\frac{319 + 381}{2} = 350$
Step3: Find Q1 (lower median)
Q1 is median of first 10 values:
$\frac{116 + 166}{2} = 141$
Step4: Find Q3 (upper median)
Q3 is median of last 10 values:
$\frac{418 + 420}{2} = 419$
Step5: Calculate IQR
$IQR = Q3 - Q1 = 419 - 141 = 278$
Step6: Find outlier bounds
Lower bound: $Q1 - 1.5 \times IQR = 141 - 1.5 \times 278 = 141 - 417 = -276$
Upper bound: $Q3 + 1.5 \times IQR = 419 + 1.5 \times 278 = 419 + 417 = 836$
Step7: Identify outliers
Value $3575 > 836$, so it is an outlier.

Snap & solve any problem in the app
Get step-by-step solutions on Sovi AI
Photo-based solutions with guided steps
Explore more problems and detailed explanations
A. The outlier(s) is/are 3575.