QUESTION IMAGE
Question
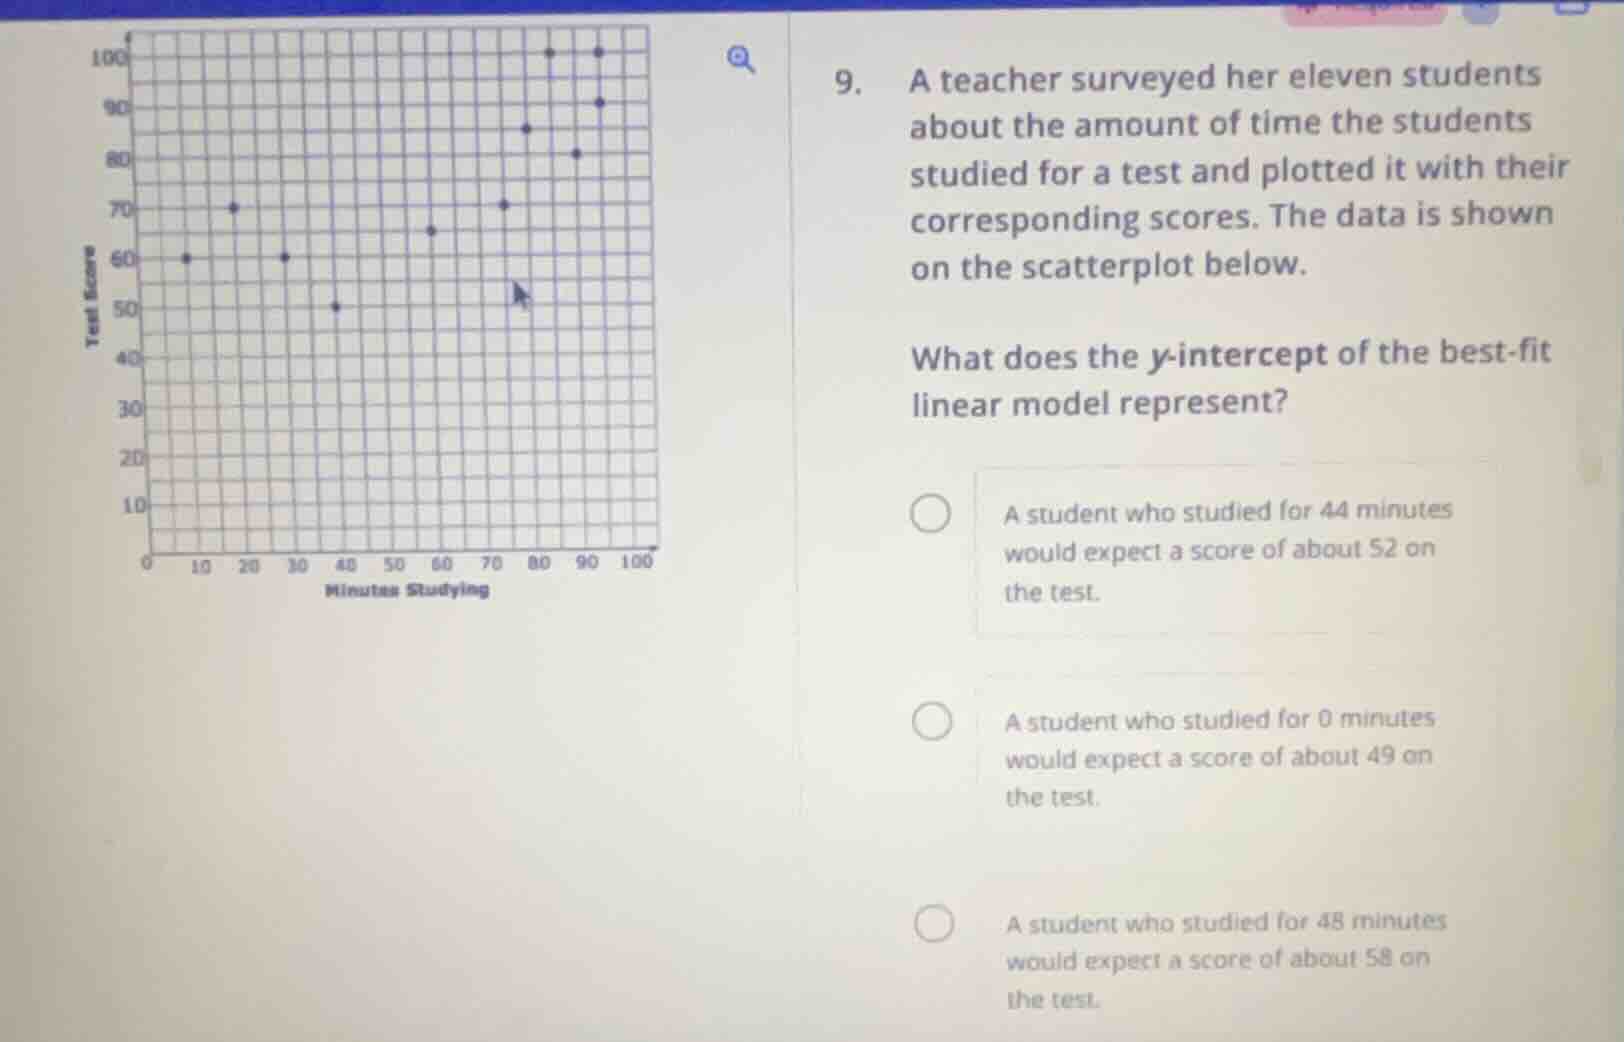
- a teacher surveyed her eleven students about the amount of time the students studied for a test and plotted it with their corresponding scores. the data is shown on the scatterplot below. what does the y-intercept of the best-fit linear model represent? a student who studied for 44 minutes would expect a score of about 52 on the test. a student who studied for 0 minutes would expect a score of about 49 on the test. a student who studied for 48 minutes would expect a score of about 58 on the test.
Brief Explanations
The y - intercept of a linear model \( y = mx + b \) occurs when \( x = 0 \). In this context, \( x \) represents the number of minutes studying and \( y \) represents the test score. So when \( x = 0 \) (0 minutes of studying), the y - intercept gives the predicted test score. We analyze each option:
- The first option refers to \( x = 44 \), which is not the y - intercept (y - intercept is at \( x = 0 \)).
- The second option refers to \( x = 0 \) (0 minutes studying) and a predicted score, which matches the definition of the y - intercept.
- The third option refers to \( x = 48 \), which is not the y - intercept.

Snap & solve any problem in the app
Get step-by-step solutions on Sovi AI
Photo-based solutions with guided steps
Explore more problems and detailed explanations
B. A student who studied for 0 minutes would expect a score of about 49 on the test. (Assuming the second option is labeled as B, if the original options had labels like A, B, C, with the second option being B)