QUESTION IMAGE
Question
unit: scatter plots and homework 4
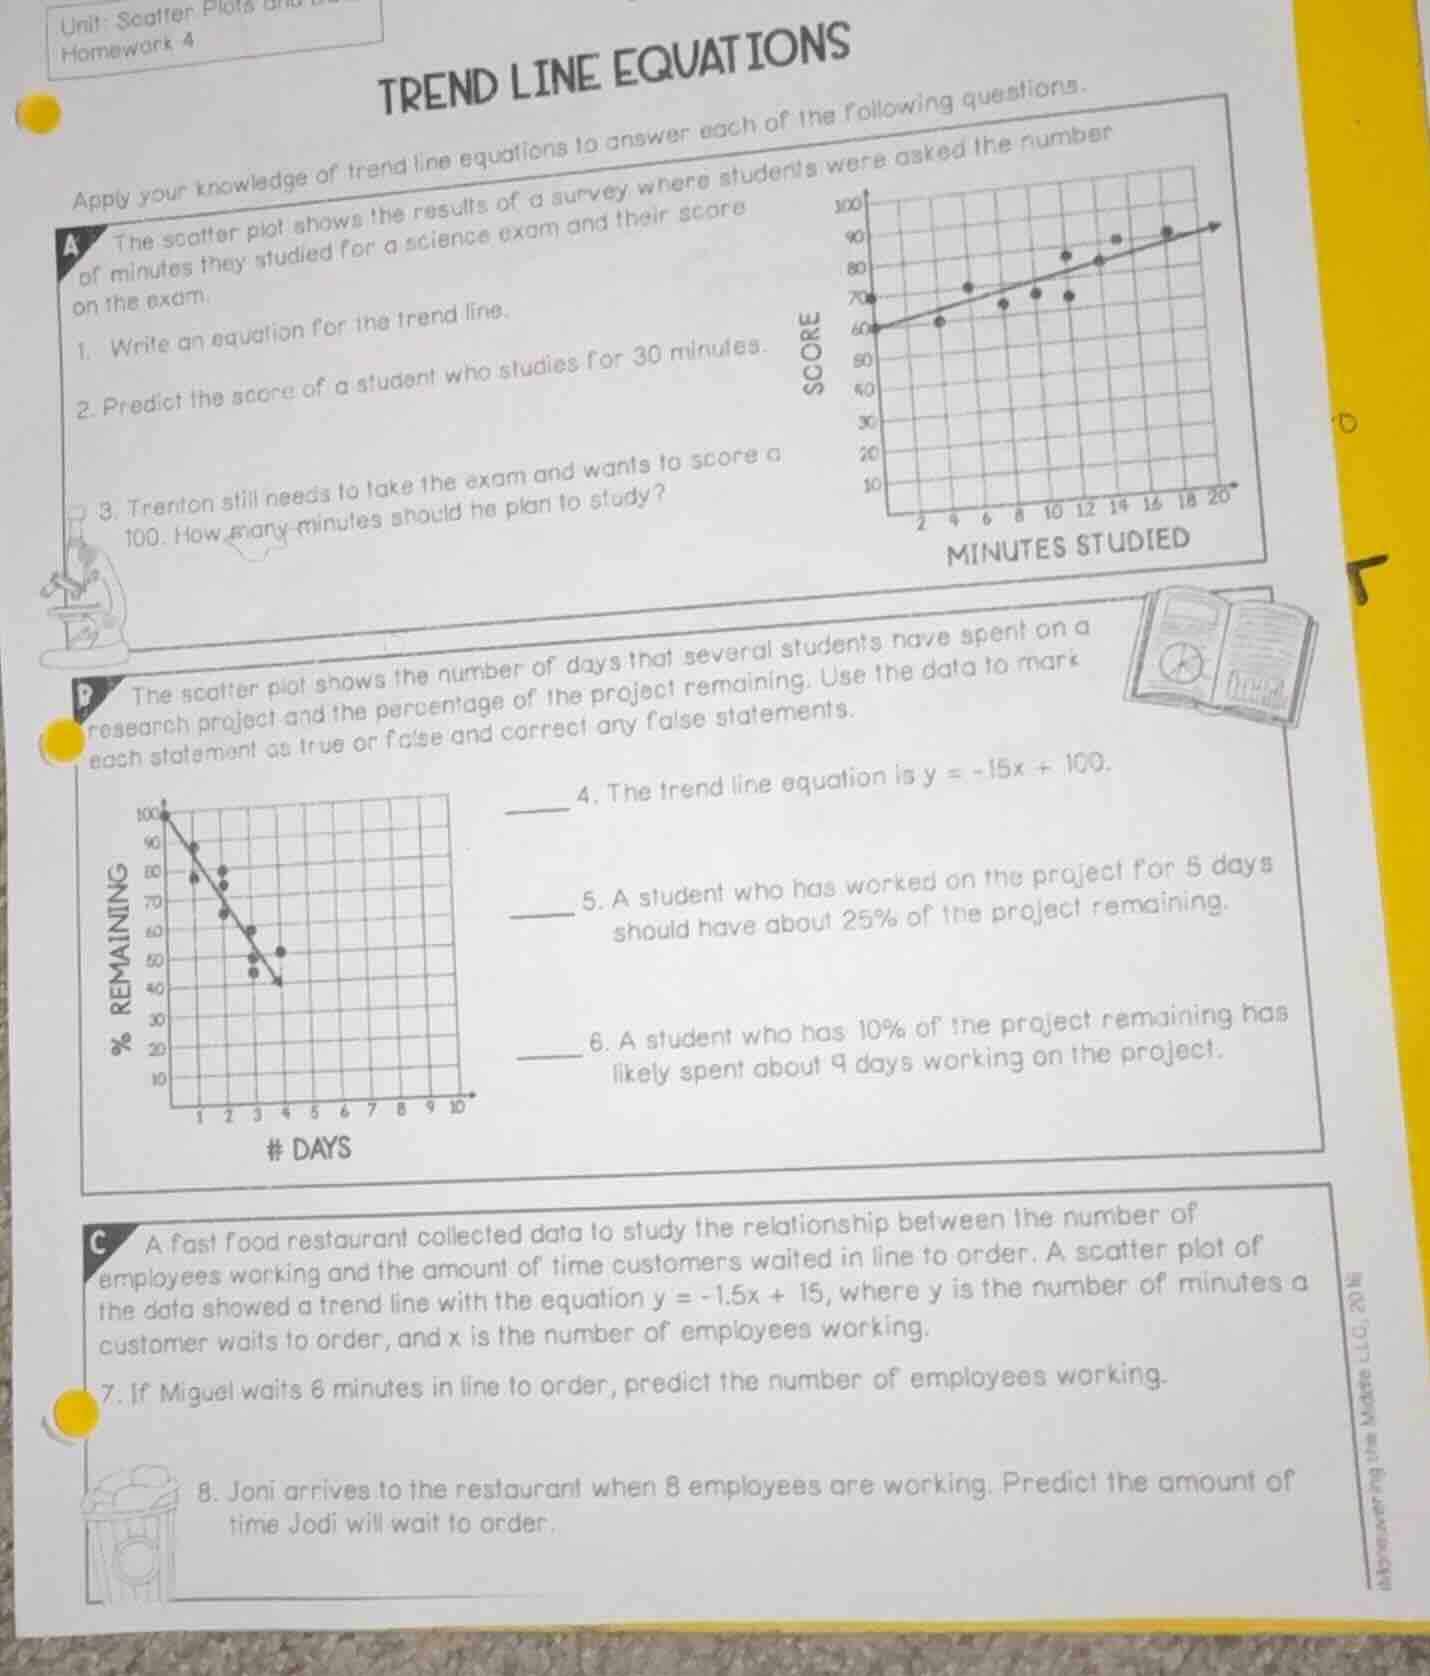
trend line equations
apply your knowledge of trend line equations to answer each of the following questions.
a the scatter plot shows the results of a survey where students were asked the number of minutes they studied for a science exam and their score on the exam.
- write an equation for the trend line.
- predict the score of a student who studies for 30 minutes.
- trenton still needs to take the exam and wants to score a 100. how many minutes should he plan to study?
(there is a scatter plot here with x - axis labeled minutes studied and y - axis labeled score)
b the scatter plot shows the number of days that several students have spent on a research project and the percentage of the project remaining. use the data to mark each statement as true or false and correct any false statements.
(there is a scatter plot here with x - axis labeled # days and y - axis labeled % remaining)
_____ 4. the trend line equation is ( y=-15x + 100 ).
_____ 5. a student who has worked on the project for 5 days should have about 25% of the project remaining.
_____ 6. a student who has 10% of the project remaining has likely spent about 9 days working on the project.
c a fast food restaurant collected data to study the relationship between the number of employees working and the amount of time customers waited in line to order. a scatter plot of the data showed a trend line with the equation ( y = - 1.5x+15 ), where ( y ) is the number of minutes a customer waits to order, and ( x ) is the number of employees working.
- if miguel waits 6 minutes in line to order, predict the number of employees working.
- joni arrives to the restaurant when 8 employees are working. predict the amount of time jodi will wait to order.
Step1: Identify trend line points
The trend line passes through (0, 60) and (20, 90).
Step2: Calculate slope
Slope $m = \frac{90-60}{20-0} = \frac{30}{20} = 1.5$
Step3: Write trend line equation
Y-intercept $b=60$, so $y=1.5x+60$
Step4: Predict score for 30 minutes
Substitute $x=30$ into $y=1.5x+60$:
$y=1.5(30)+60=45+60=105$
Step5: Find minutes for score 100
Set $y=100$, solve for $x$:
$100=1.5x+60$
$1.5x=100-60=40$
$x=\frac{40}{1.5}\approx26.67$
Step6: Verify trend line for section B
Trend line passes through (0,100) and (5,40). Slope $m=\frac{40-100}{5-0}=-12$, so equation is $y=-12x+100$. Statement 4 is false.
Step7: Check statement 5 for section B
Substitute $x=5$ into $y=-12x+100$:
$y=-12(5)+100=-60+100=40$. Statement 5 is false.
Step8: Check statement 6 for section B
Set $y=10$, solve for $x$:
$10=-12x+100$
$-12x=10-100=-90$
$x=\frac{-90}{-12}=7.5$. Statement 6 is false.
Step9: Find employees for 6 minute wait
Use $y=-1.5x+15$, substitute $y=6$:
$6=-1.5x+15$
$-1.5x=6-15=-9$
$x=\frac{-9}{-1.5}=6$
Step10: Find wait time for 8 employees
Substitute $x=8$ into $y=-1.5x+15$:
$y=-1.5(8)+15=-12+15=3$

Snap & solve any problem in the app
Get step-by-step solutions on Sovi AI
Photo-based solutions with guided steps
Explore more problems and detailed explanations
- $y=1.5x+60$
- 105
- Approximately 26.67 minutes
- False, correct equation: $y=-12x+100$
- False, about 40% of the project remains
- False, likely spent about 7.5 days
- 6 employees
- 3 minutes