QUESTION IMAGE
Question
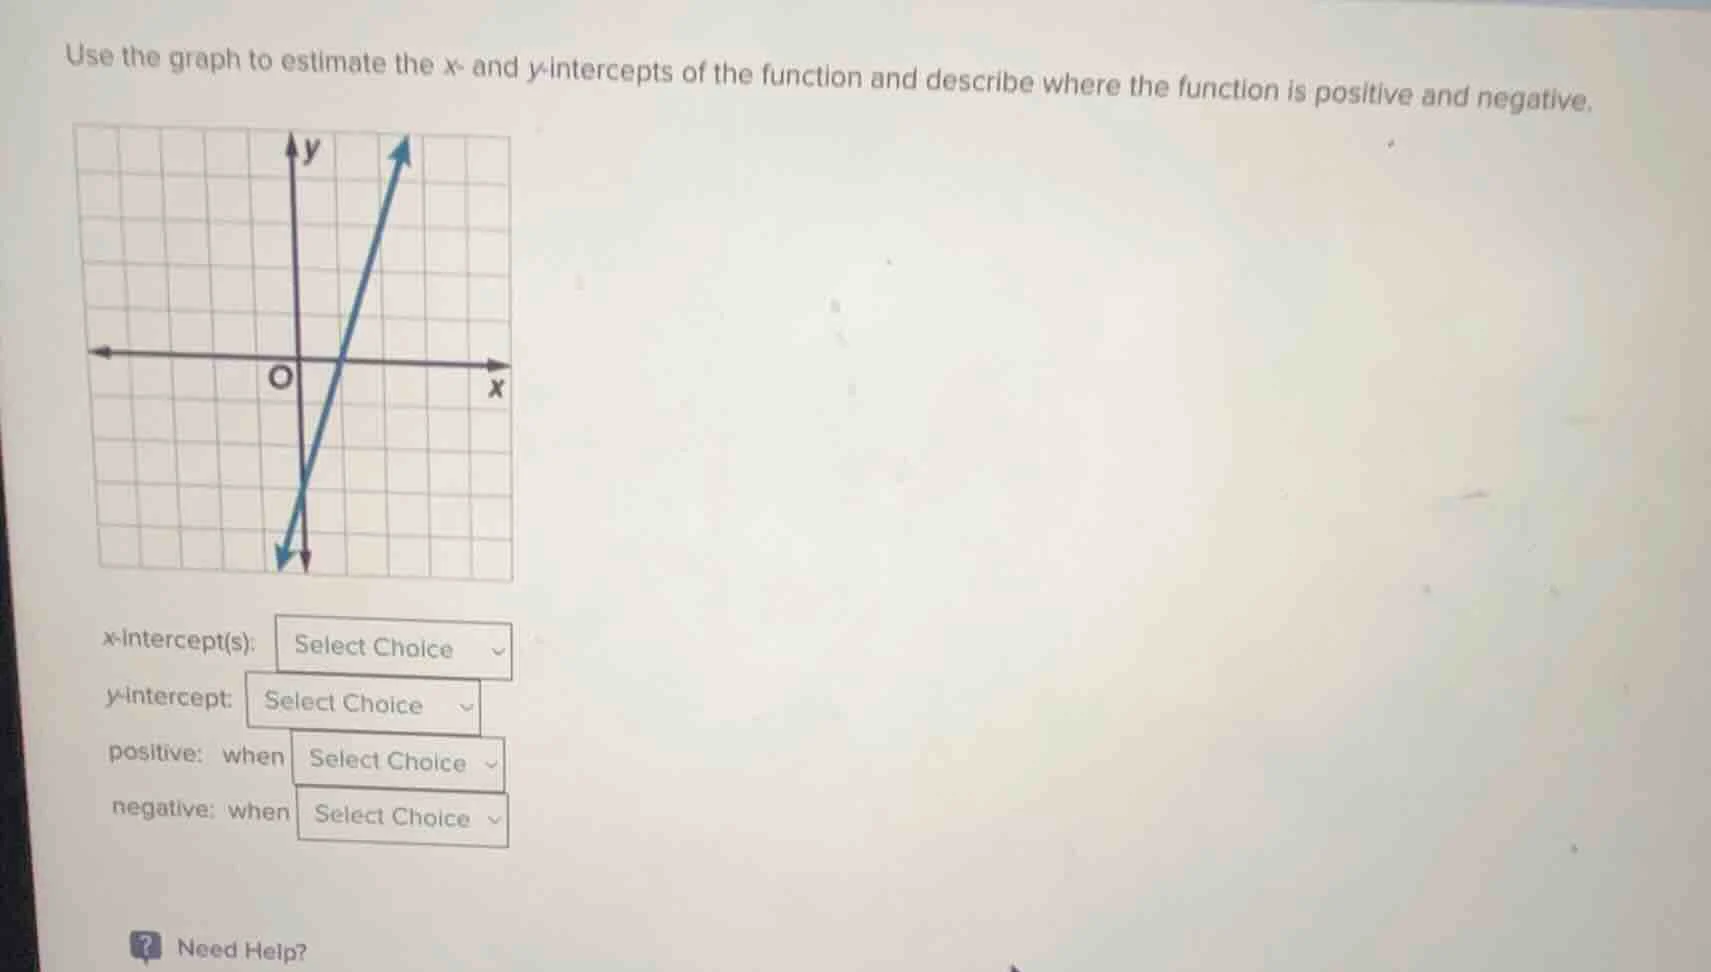
use the graph to estimate the x- and y-intercepts of the function and describe where the function is positive and negative.
x-intercept(s): select choice
y-intercept: select choice
positive: when select choice
negative: when select choice
need help?
Step1: Find x - intercept
The x - intercept is the point where the graph crosses the x - axis. From the graph, the line crosses the x - axis at \(x = 1\) (assuming the grid has integer coordinates and the intersection is at \((1,0)\)). So the x - intercept is \((1,0)\) or \(x = 1\).
Step2: Find y - intercept
The y - intercept is the point where the graph crosses the y - axis. From the graph, the line crosses the y - axis at \(y=-2\) (assuming the grid has integer coordinates and the intersection is at \((0, - 2)\)). So the y - intercept is \((0,-2)\) or \(y=-2\).
Step3: Determine where the function is positive
A function is positive when its graph is above the x - axis. Looking at the graph, the line has a positive slope. For \(x>1\), the graph is above the x - axis, so the function is positive when \(x > 1\).
Step4: Determine where the function is negative
A function is negative when its graph is below the x - axis. Looking at the graph, for \(x<1\), the graph is below the x - axis, so the function is negative when \(x < 1\).

Snap & solve any problem in the app
Get step-by-step solutions on Sovi AI
Photo-based solutions with guided steps
Explore more problems and detailed explanations
x - intercept: \((1,0)\) (or \(x = 1\))
y - intercept: \((0,-2)\) (or \(y=-2\))
Positive: when \(x>1\)
Negative: when \(x < 1\)