QUESTION IMAGE
Question
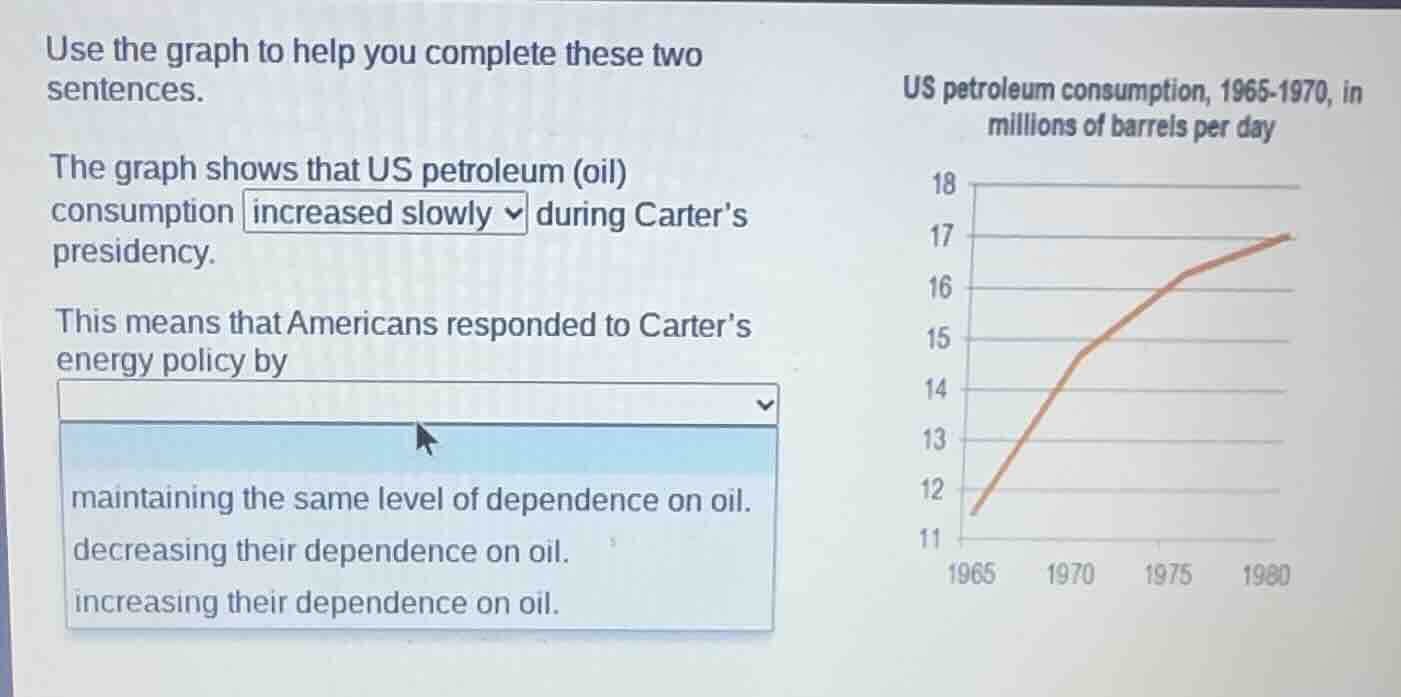
use the graph to help you complete these two sentences.
the graph shows that us petroleum (oil) consumption increased slowly during carter’s presidency.
this means that americans responded to carter’s energy policy by
maintaining the same level of dependence on oil.
decreasing their dependence on oil.
increasing their dependence on oil.
us petroleum consumption, 1965 - 1970, in millions of barrels per day
graph with x - axis 1965, 1970, 1975, 1980 and y - axis 11 - 18, line showing increasing consumption
First, Jimmy Carter was president from 1977 to 1981, which falls within the graph's 1965-1980 timeframe. The graph shows US petroleum consumption rose consistently through this period, including Carter's presidency, meaning it increased (not slowly, as the initial dropdown suggests). Rising consumption directly means Americans used more oil, so their dependence on oil grew.

Snap & solve any problem in the app
Get step-by-step solutions on Sovi AI
Photo-based solutions with guided steps
Explore more problems and detailed explanations
- The graph shows that US petroleum (oil) consumption increased during Carter's presidency.
- This means that Americans responded to Carter's energy policy by increasing their dependence on oil.