QUESTION IMAGE
Question
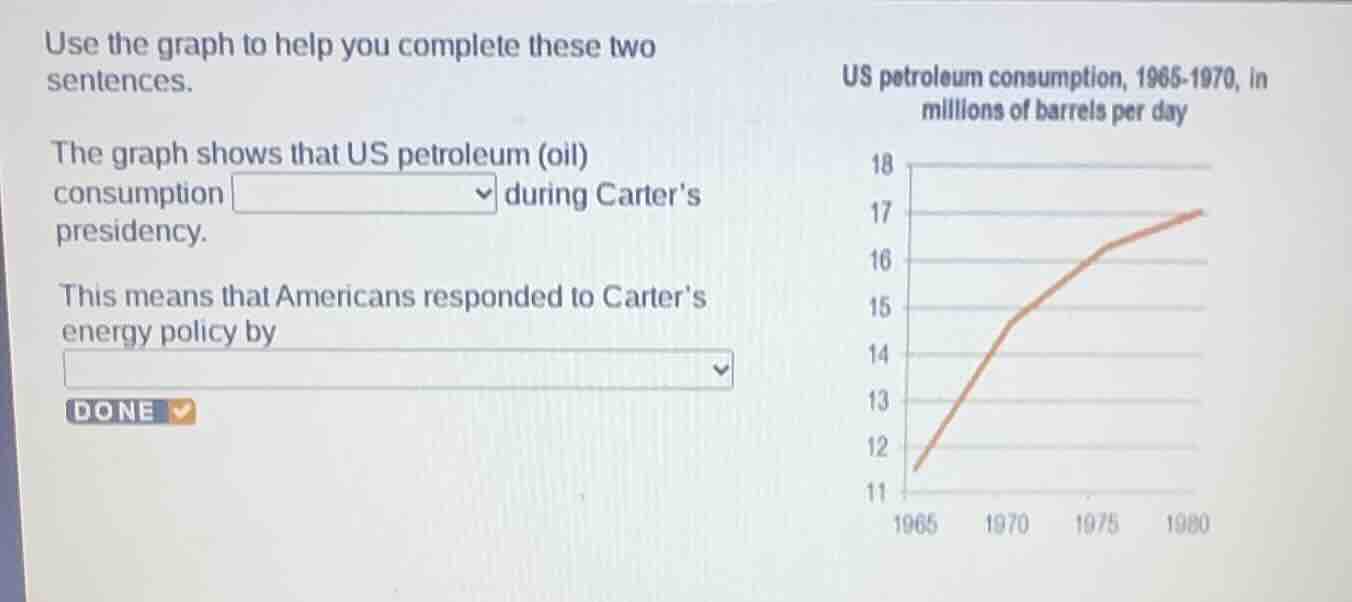
use the graph to help you complete these two sentences.
the graph shows that us petroleum (oil) consumption
during carter’s presidency.
this means that americans responded to carter’s energy policy by
us petroleum consumption, 1965 - 1970, in millions of barrels per day
18
17
16
15
14
13
12
11
1965 1970 1975 1980
done
Brief Explanations
- First, note Jimmy Carter was US president from 1977 to 1981, which falls within the graph's later period (1975-1980). The line graph clearly shows an upward trend in US petroleum consumption through this interval.
- Carter's energy policies focused on reducing petroleum use (via conservation, alternative energy promotion, etc.). The rising consumption shown means Americans did not follow the intent of these policies, instead increasing their petroleum use.

Snap & solve any problem in the app
Get step-by-step solutions on Sovi AI
Photo-based solutions with guided steps
Explore more problems and detailed explanations
- The graph shows that US petroleum (oil) consumption increased during Carter's presidency.
- This means that Americans responded to Carter's energy policy by increasing their petroleum use (failing to reduce consumption).