QUESTION IMAGE
Question
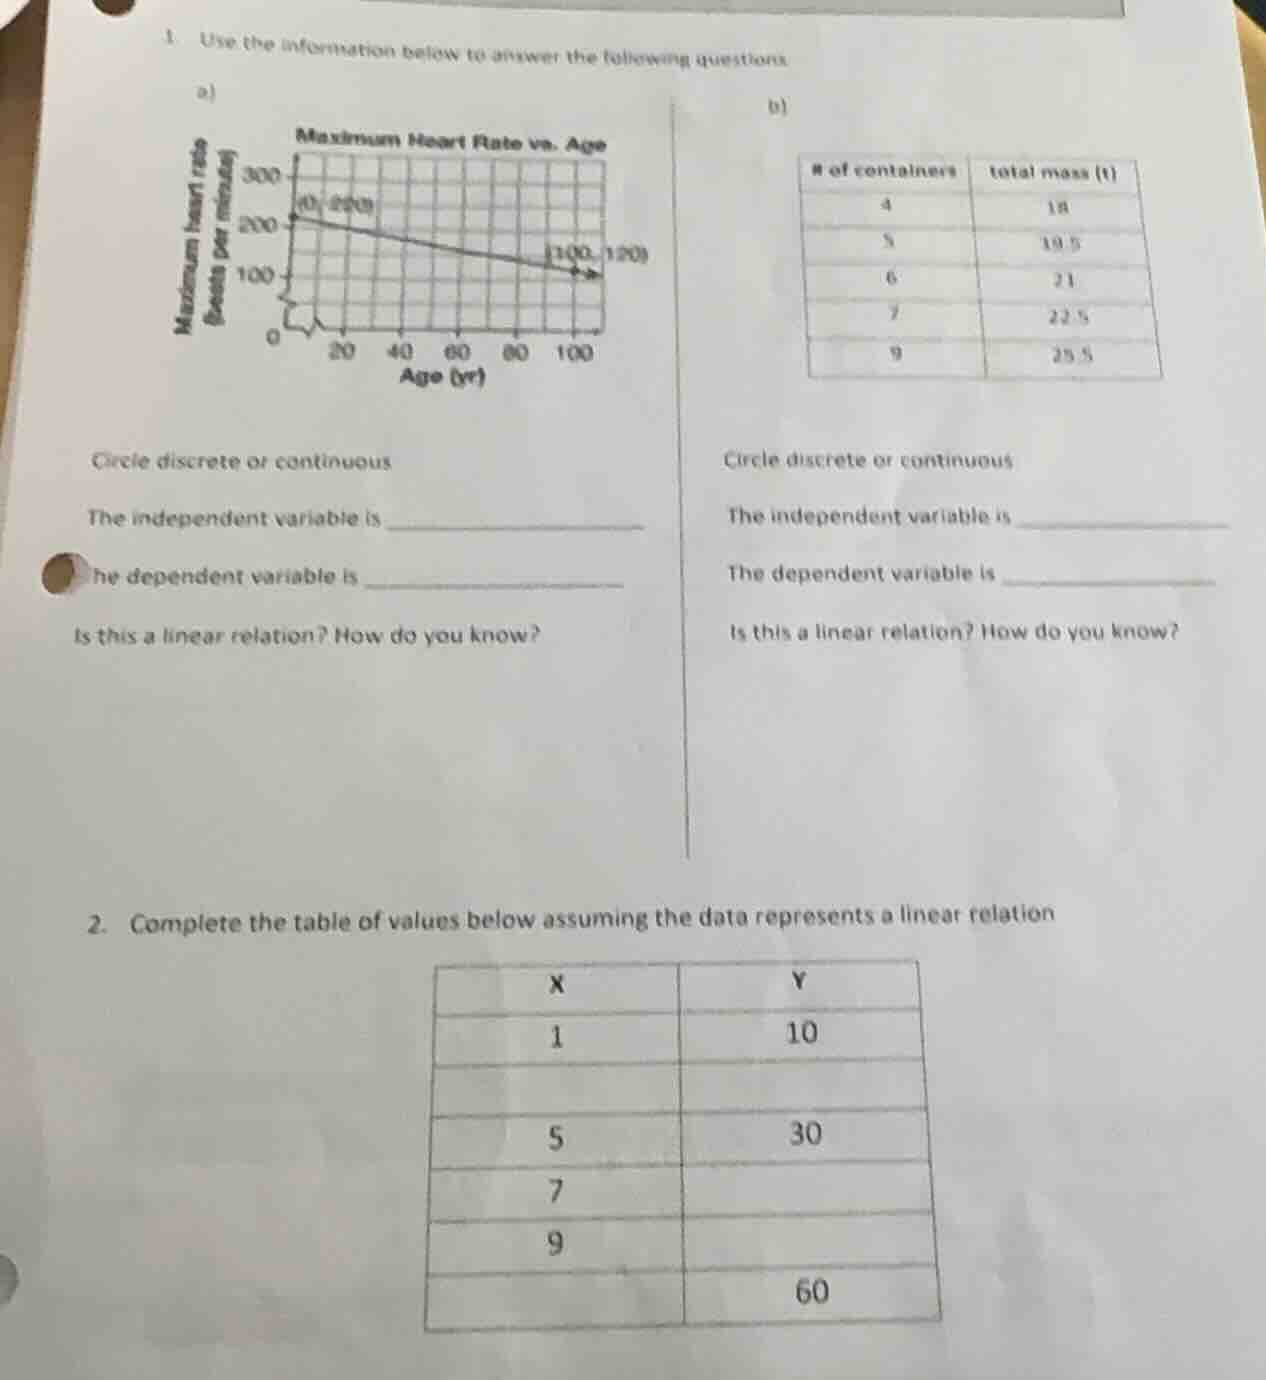
- use the information below to answer the following questions.
a)
circle discrete or continuous
the independent variable is _______________
the dependent variable is _______________
is this a linear relation? how do you know?
b)
| # of containers | total mass (t) |
|---|---|
| 5 | 19.5 |
| 6 | 21 |
| 7 | 22.5 |
| 9 | 25.5 |
circle discrete or continuous
the independent variable is _______________
the dependent variable is _______________
is this a linear relation? how do you know?
- complete the table of values below assuming the data represents a linear relation
| x | y |
|---|---|
| 5 | 30 |
| 7 | |
| 9 | |
| 60 |
---
1a)
Step1: Classify variable types
Age and heart rate can take any value within a range, so continuous (circle this).
Step2: Identify independent variable
Independent variable: Age (it is the input variable).
Step3: Identify dependent variable
Dependent variable: Maximum heart rate (depends on age).
Step4: Check linearity
The graph is a straight line, so it is linear.
Step1: Classify variable types
Number of containers is a whole number (counted), so discrete (circle this); total mass is continuous, but the independent variable defines the classification here.
Step2: Identify independent variable
Independent variable: # of containers (input variable).
Step3: Identify dependent variable
Dependent variable: total mass (depends on container count).
Step4: Check linearity
Calculate the rate of change:
$\frac{19.5-18}{5-4}=1.5$, $\frac{21-19.5}{6-5}=1.5$, $\frac{22.5-21}{7-6}=1.5$, $\frac{25.5-22.5}{9-7}=1.5$. The rate of change is constant.
Step1: Calculate slope
Use points $(1,10)$ and $(5,30)$. Slope $m=\frac{30-10}{5-1}=\frac{20}{4}=5$.
Step2: Find linear equation
Use $y=mx+b$. Substitute $x=1, y=10, m=5$:
$10=5(1)+b \implies b=5$. Equation: $y=5x+5$.
Step3: Solve for missing values
- For $x=3$: $y=5(3)+5=20$
- For $x=7$: $y=5(7)+5=40$
- For $x=9$: $y=5(9)+5=50$
- For $y=60$: $60=5x+5 \implies 5x=55 \implies x=11$

Snap & solve any problem in the app
Get step-by-step solutions on Sovi AI
Photo-based solutions with guided steps
Explore more problems and detailed explanations
Circle: continuous
The independent variable is $\boldsymbol{Age}$
The dependent variable is $\boldsymbol{Maximum\ heart\ rate}$
Yes, it is a linear relation. The graph is a straight line.
---