QUESTION IMAGE
Question
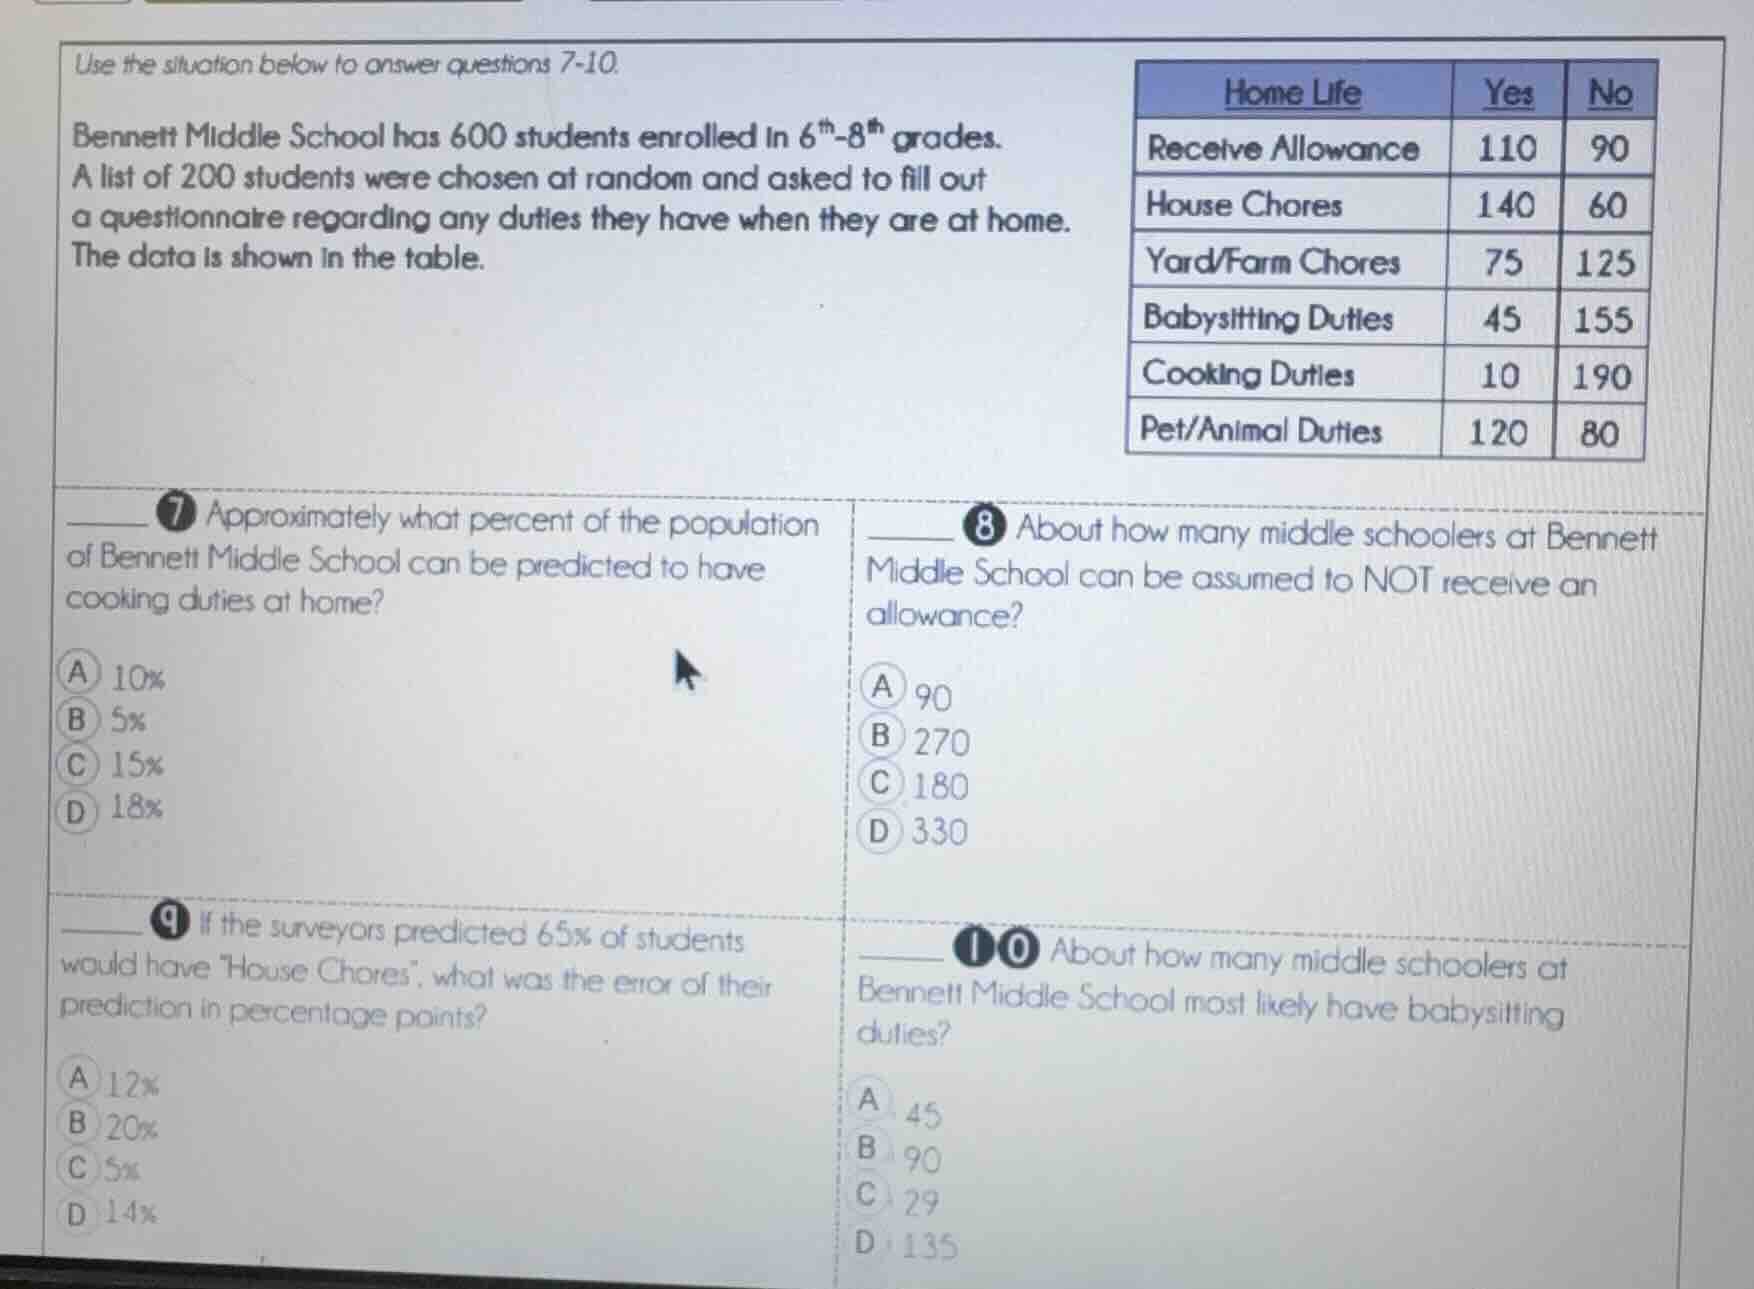
use the situation below to answer questions 7-10.
bennett middle school has 600 students enrolled in $6^{th}$-$8^{th}$ grades.
a list of 200 students were chosen at random and asked to fill out
a questionnaire regarding any duties they have when they are at home.
the data is shown in the table.
| home life | yes | no |
|---|---|---|
| house chores | 140 | 60 |
| yard/farm chores | 75 | 125 |
| babysitting duties | 45 | 155 |
| cooking duties | 10 | 190 |
| pet/animal duties | 120 | 80 |
7 approximately what percent of the population of bennett middle school can be predicted to have cooking duties at home?
a 10%
b 5%
c 15%
d 18%
8 about how many middle schoolers at bennett middle school can be assumed to not receive an allowance?
a 90
b 270
c 180
d 330
9 if the surveyors predicted 65% of students would have \house chores\, what was the error of their prediction in percentage points?
a 12%
b 20%
c 5%
d 14%
10 about how many middle schoolers at bennett middle school most likely have babysitting duties?
a 45
b 90
c 29
d 135
Step1: Calculate sample % for cooking
$\frac{10}{200} \times 100\% = 5\%$
Step2: Calculate non-allowance population
$\frac{90}{200} \times 600 = 270$
Step3: Calculate actual house chores %
$\frac{140}{200} \times 100\% = 70\%$
Step4: Find prediction error
$|70\% - 65\%| = 5\%$
Step5: Calculate babysitting population
$\frac{45}{200} \times 600 = 135$

Snap & solve any problem in the app
Get step-by-step solutions on Sovi AI
Photo-based solutions with guided steps
Explore more problems and detailed explanations
- B. 5%
- B. 270
- C. 5%
- D. 135