QUESTION IMAGE
Question
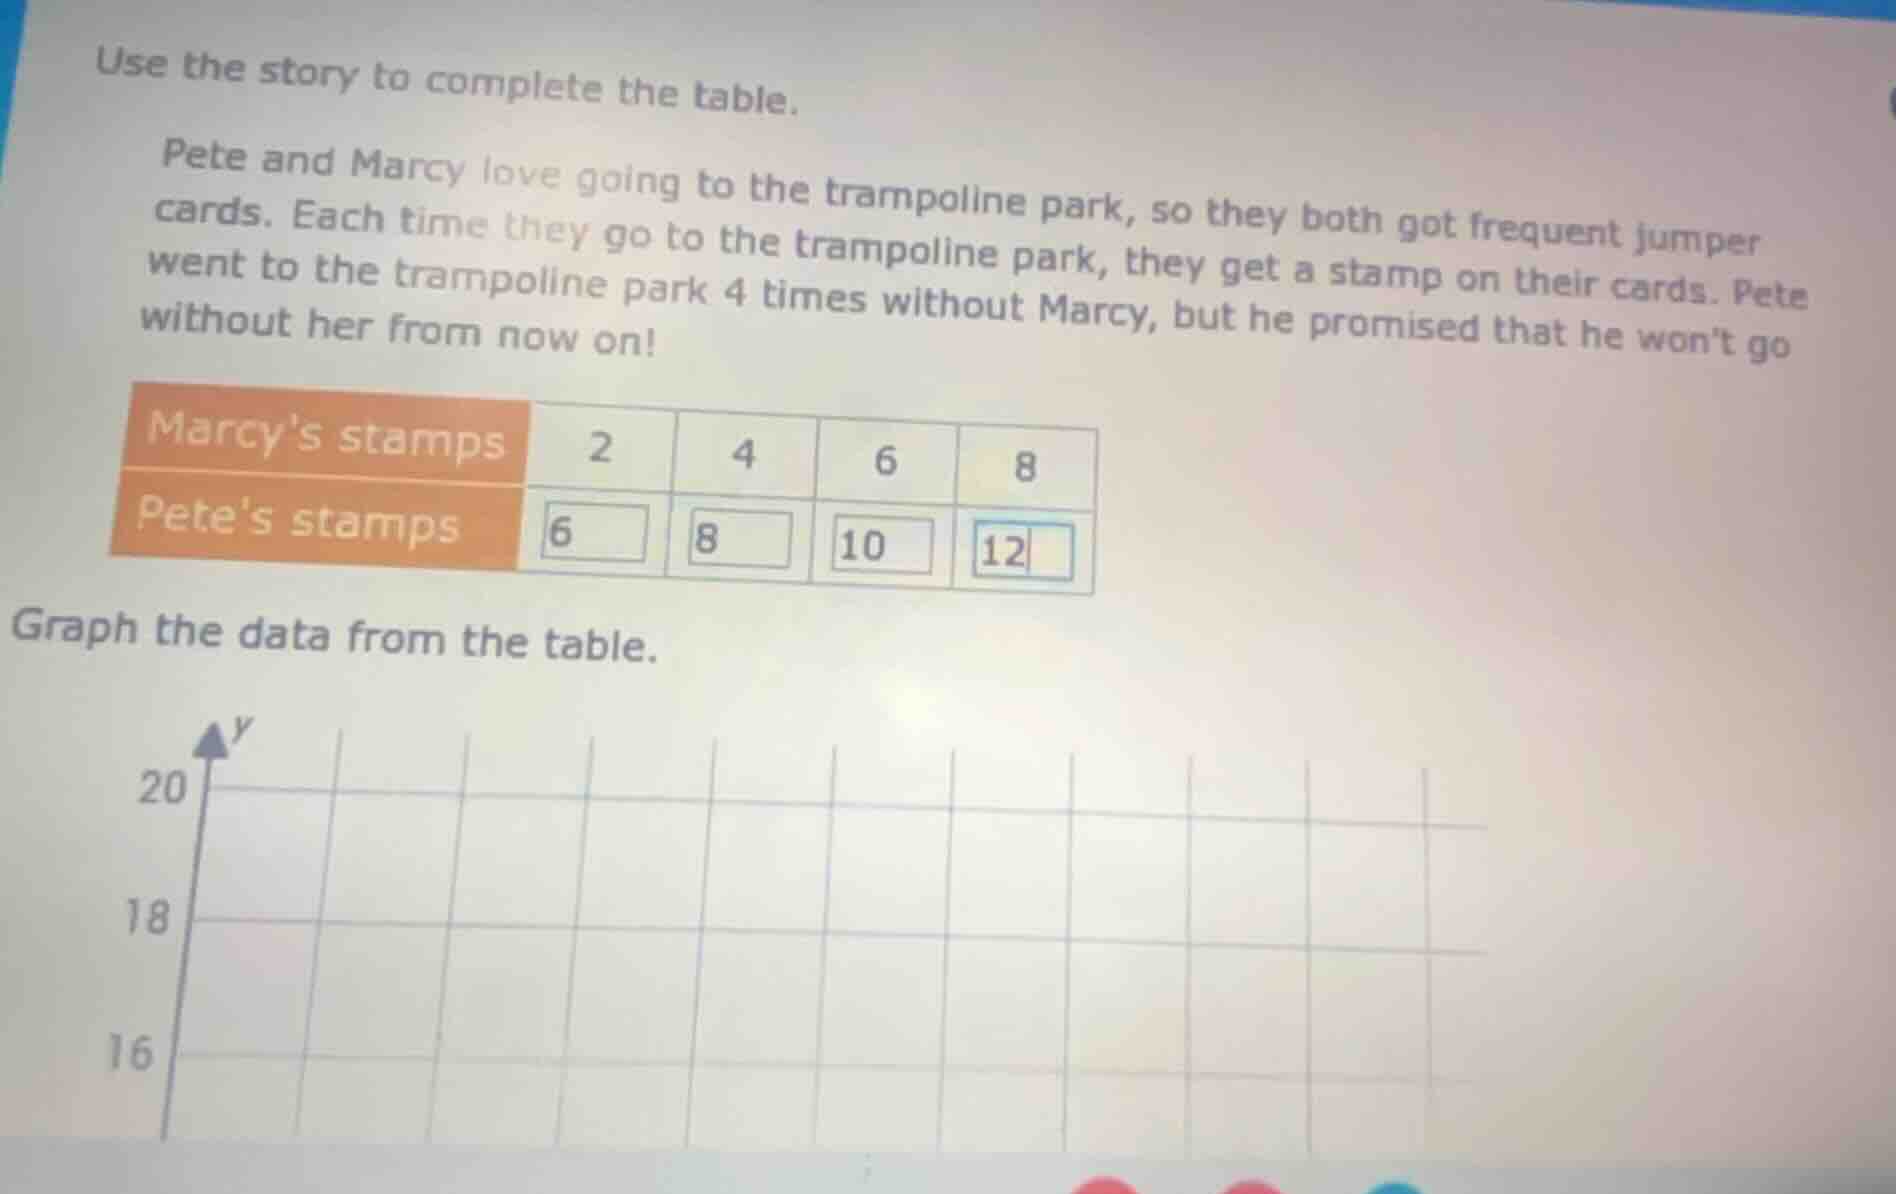
use the story to complete the table.
pete and marcy love going to the trampoline park, so they both got frequent jumper cards. each time they go to the trampoline park, they get a stamp on their cards. pete went to the trampoline park 4 times without marcy, but he promised that he wont go without her from now on!
| marcys stamps | 2 | 4 | 6 | 8 |
|---|
graph the data from the table.
(graph with y - axis labeled from 16 to 20)
Part 1: Completing the Table (Understanding the Relationship)
To graph the data, we first confirm the relationship between Marcy’s and Pete’s stamps. From the story, Pete went 4 times without Marcy, so the difference between Pete’s and Marcy’s stamps is 4 (e.g., when Marcy has 2, Pete has \(2 + 4=6\); when Marcy has 4, Pete has \(4 + 4 = 8\), etc.). So the table is already correctly filled with Pete’s stamps as \(6, 8, 10, 12\) for Marcy’s \(2, 4, 6, 8\).
Part 2: Graphing the Data
Step 1: Identify the Axes
- Let the \(x\)-axis represent Marcy’s stamps (values: \(2, 4, 6, 8\)).
- Let the \(y\)-axis represent Pete’s stamps (values: \(6, 8, 10, 12\)).
Step 2: Plot the Points
- For \((x = 2, y = 6)\): Locate \(x = 2\) on the \(x\)-axis and \(y = 6\) on the \(y\)-axis, mark the point.
- For \((x = 4, y = 8)\): Locate \(x = 4\) and \(y = 8\), mark the point.
- For \((x = 6, y = 10)\): Locate \(x = 6\) and \(y = 10\), mark the point.
- For \((x = 8, y = 12)\): Locate \(x = 8\) and \(y = 12\), mark the point.
Step 3: Connect the Points (Optional, for Linear Relationship)
Since the relationship \(y=x + 4\) (where \(x\) is Marcy’s stamps, \(y\) is Pete’s stamps) is linear, connect the plotted points with a straight line to show the trend.
Final Graph Description (Key Points Plotted)
| Marcy’s Stamps (\(x\)) | Pete’s Stamps (\(y\)) | Coordinates \((x, y)\) |
|---|---|---|
| 4 | 8 | \((4, 8)\) |
| 6 | 10 | \((6, 10)\) |
| 8 | 12 | \((8, 12)\) |
Plot these points on the given graph (with \(x\)-axis for Marcy’s stamps and \(y\)-axis for Pete’s stamps) and draw a line through them.

Snap & solve any problem in the app
Get step-by-step solutions on Sovi AI
Photo-based solutions with guided steps
Explore more problems and detailed explanations
Part 1: Completing the Table (Understanding the Relationship)
To graph the data, we first confirm the relationship between Marcy’s and Pete’s stamps. From the story, Pete went 4 times without Marcy, so the difference between Pete’s and Marcy’s stamps is 4 (e.g., when Marcy has 2, Pete has \(2 + 4=6\); when Marcy has 4, Pete has \(4 + 4 = 8\), etc.). So the table is already correctly filled with Pete’s stamps as \(6, 8, 10, 12\) for Marcy’s \(2, 4, 6, 8\).
Part 2: Graphing the Data
Step 1: Identify the Axes
- Let the \(x\)-axis represent Marcy’s stamps (values: \(2, 4, 6, 8\)).
- Let the \(y\)-axis represent Pete’s stamps (values: \(6, 8, 10, 12\)).
Step 2: Plot the Points
- For \((x = 2, y = 6)\): Locate \(x = 2\) on the \(x\)-axis and \(y = 6\) on the \(y\)-axis, mark the point.
- For \((x = 4, y = 8)\): Locate \(x = 4\) and \(y = 8\), mark the point.
- For \((x = 6, y = 10)\): Locate \(x = 6\) and \(y = 10\), mark the point.
- For \((x = 8, y = 12)\): Locate \(x = 8\) and \(y = 12\), mark the point.
Step 3: Connect the Points (Optional, for Linear Relationship)
Since the relationship \(y=x + 4\) (where \(x\) is Marcy’s stamps, \(y\) is Pete’s stamps) is linear, connect the plotted points with a straight line to show the trend.
Final Graph Description (Key Points Plotted)
| Marcy’s Stamps (\(x\)) | Pete’s Stamps (\(y\)) | Coordinates \((x, y)\) |
|---|---|---|
| 4 | 8 | \((4, 8)\) |
| 6 | 10 | \((6, 10)\) |
| 8 | 12 | \((8, 12)\) |
Plot these points on the given graph (with \(x\)-axis for Marcy’s stamps and \(y\)-axis for Pete’s stamps) and draw a line through them.