QUESTION IMAGE
Question
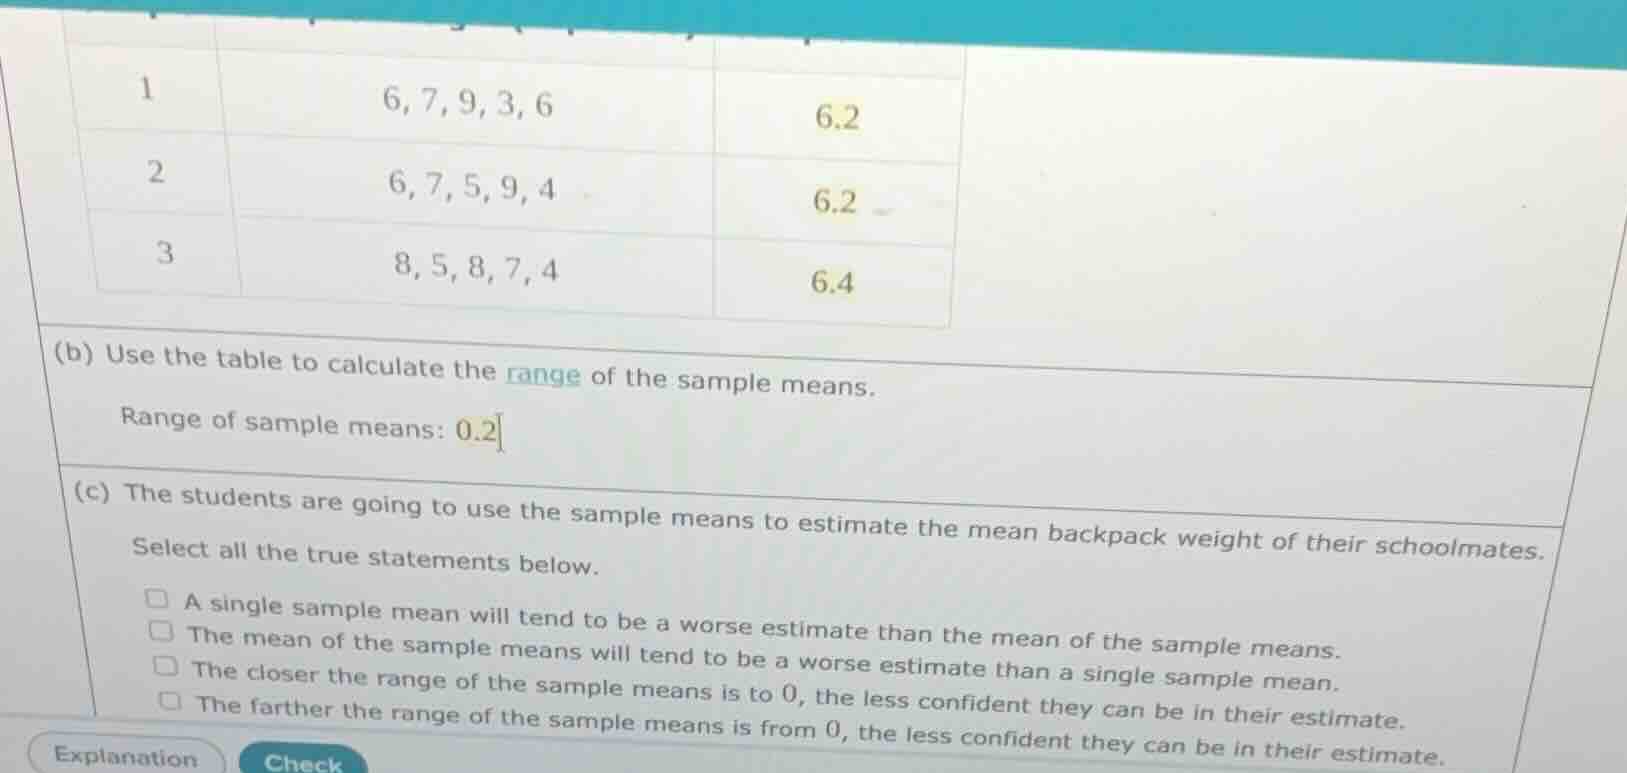
(b) use the table to calculate the range of the sample means.
range of sample means: 0.2
(c) the students are going to use the sample means to estimate the mean backpack weight of their schoolmates.
select all the true statements below.
□ a single sample mean will tend to be a worse estimate than the mean of the sample means.
□ the mean of the sample means will tend to be a worse estimate than a single sample mean.
□ the closer the range of the sample means is to 0, the less confident they can be in their estimate.
□ the farther the range of the sample means is from 0, the less confident they can be in their estimate.
Part (b)
Step1: Identify sample means
The sample means are \( 6.2 \), \( 6.2 \), and \( 6.4 \).
Step2: Find max and min
Max sample mean \( = 6.4 \), Min sample mean \( = 6.2 \).
Step3: Calculate range
Range \( = \text{Max} - \text{Min} = 6.4 - 6.2 = 0.2 \).
- Statement A: A single sample mean has more variability; the mean of sample means (central limit theorem) is a better estimate. So A is true.
- Statement B: Contradicts A; mean of sample means is better. So B is false.
- Statement C: Closer range (less variability) means more confidence, not less. So C is false.
- Statement D: Farther range (more variability) means less confidence. So D is true.

Snap & solve any problem in the app
Get step-by-step solutions on Sovi AI
Photo-based solutions with guided steps
Explore more problems and detailed explanations
\( 0.2 \)