QUESTION IMAGE
Question
- use the word bank to compare ocean tides and ocean currents.
word bank
moon’s gravity wind patterns up (high) down (low)
movement water temperature differences
underwater river
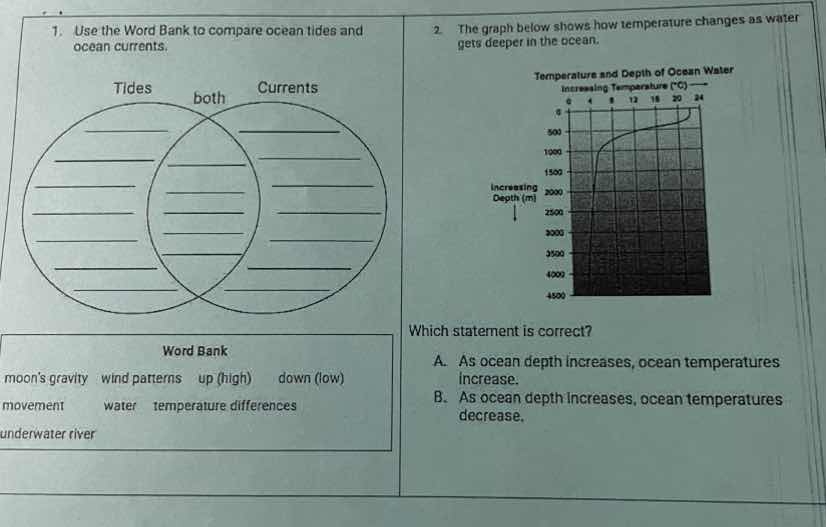
- the graph below shows how temperature changes as water gets deeper in the ocean.
which statement is correct?
a. as ocean depth increases, ocean temperatures increase.
b. as ocean depth increases, ocean temperatures decrease.
Sub - question 1: Venn Diagram for Tides and Currents
Step - by - Step Explanation
Step 1: Analyze Tides
Tides are mainly caused by the moon's gravity. They involve the water moving up (high) and down (low). So for the "Tides" circle, we can put: moon’s gravity, up (high), down (low).
Step 2: Analyze Both (Tides and Currents)
Both tides and currents involve the movement of water. So for the "both" overlapping region, we put: movement, water.
Step 3: Analyze Currents
Currents are affected by wind patterns, temperature differences, and can be like an underwater river. So for the "Currents" circle, we put: wind patterns, temperature differences, underwater river.
Sub - question 2: Analyze the Graph for Temperature and Depth
Step - by - Step Explanation
Step 1: Interpret the Graph Axes
The x - axis represents temperature (increasing to the right) and the y - axis represents depth (increasing downward, meaning as we go down, depth increases).
Step 2: Analyze the Trend
Looking at the graph, as the depth (y - axis, going from 0 to 4000 m) increases (moves down the y - axis), the temperature (x - axis) decreases. For example, at shallow depths (near 0 m), the temperature is higher, and at greater depths (like 4000 m), the temperature is lower.
Step 3: Evaluate the Options
- Option A: Says as ocean depth increases, temperature increases. But from the graph, we see the opposite. So A is incorrect.
- Option B: Says as ocean depth increases, temperature decreases. This matches the trend we observed from the graph. So B is correct.
Final Answers
Sub - question 1 (Venn Diagram)
- Tides: moon’s gravity, up (high), down (low)
- Both: movement, water
- Currents: wind patterns, temperature differences, underwater river
Sub - question 2
The graph shows that as depth (y - axis, increasing downward) increases, temperature (x - axis) decreases. Option A is incorrect as it states the opposite trend. Option B matches the trend.

Snap & solve any problem in the app
Get step-by-step solutions on Sovi AI
Photo-based solutions with guided steps
Explore more problems and detailed explanations
B. As ocean depth increases, ocean temperatures decrease.