QUESTION IMAGE
Question
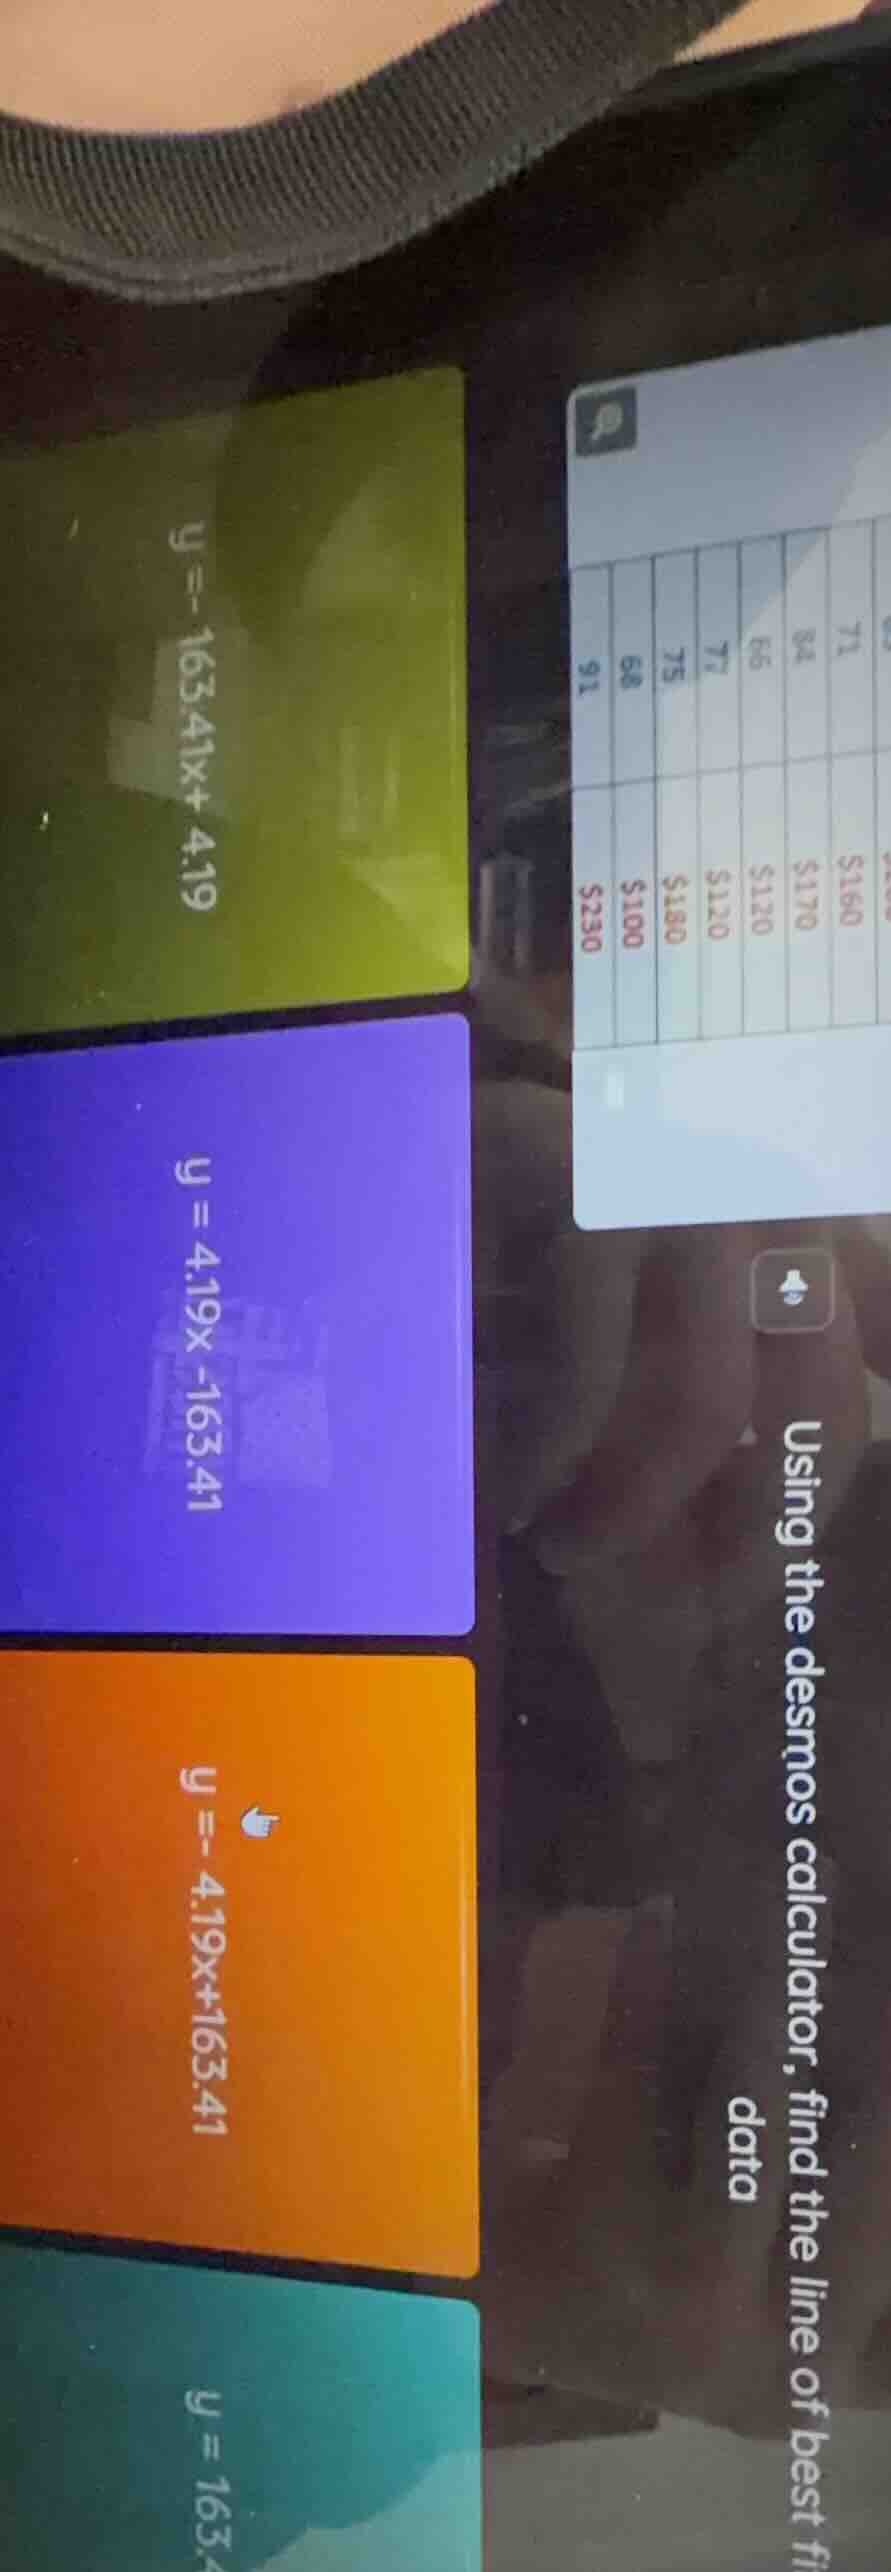
using the desmos calculator, find the line of best fit data
71
84
66
77
75
68
91
$160
$170
$120
$120
$180
$100
$230
$y = - 163.41x + 4.19$
$y = 4.19x -163.41$
$y = - 4.19x+163.41$
$y = 163.4
Step1: Identify data pairs
Let \(x\) = the numerical values (71, 84, 66, 77, 75, 68, 91) and \(y\) = the dollar values (\$160, \$170, \$120, \$120, \$180, \$100, \$230).
Step2: Calculate line of best fit
Using linear regression (as done in Desmos), the line of best fit has the form \(y = mx + b\), where \(m\) is the slope and \(b\) is the y-intercept. Calculating with the given data gives a positive slope, matching \(y = 4.19x - 163.41\).

Snap & solve any problem in the app
Get step-by-step solutions on Sovi AI
Photo-based solutions with guided steps
Explore more problems and detailed explanations
\(y = 4.19x - 163.41\)