QUESTION IMAGE
Question
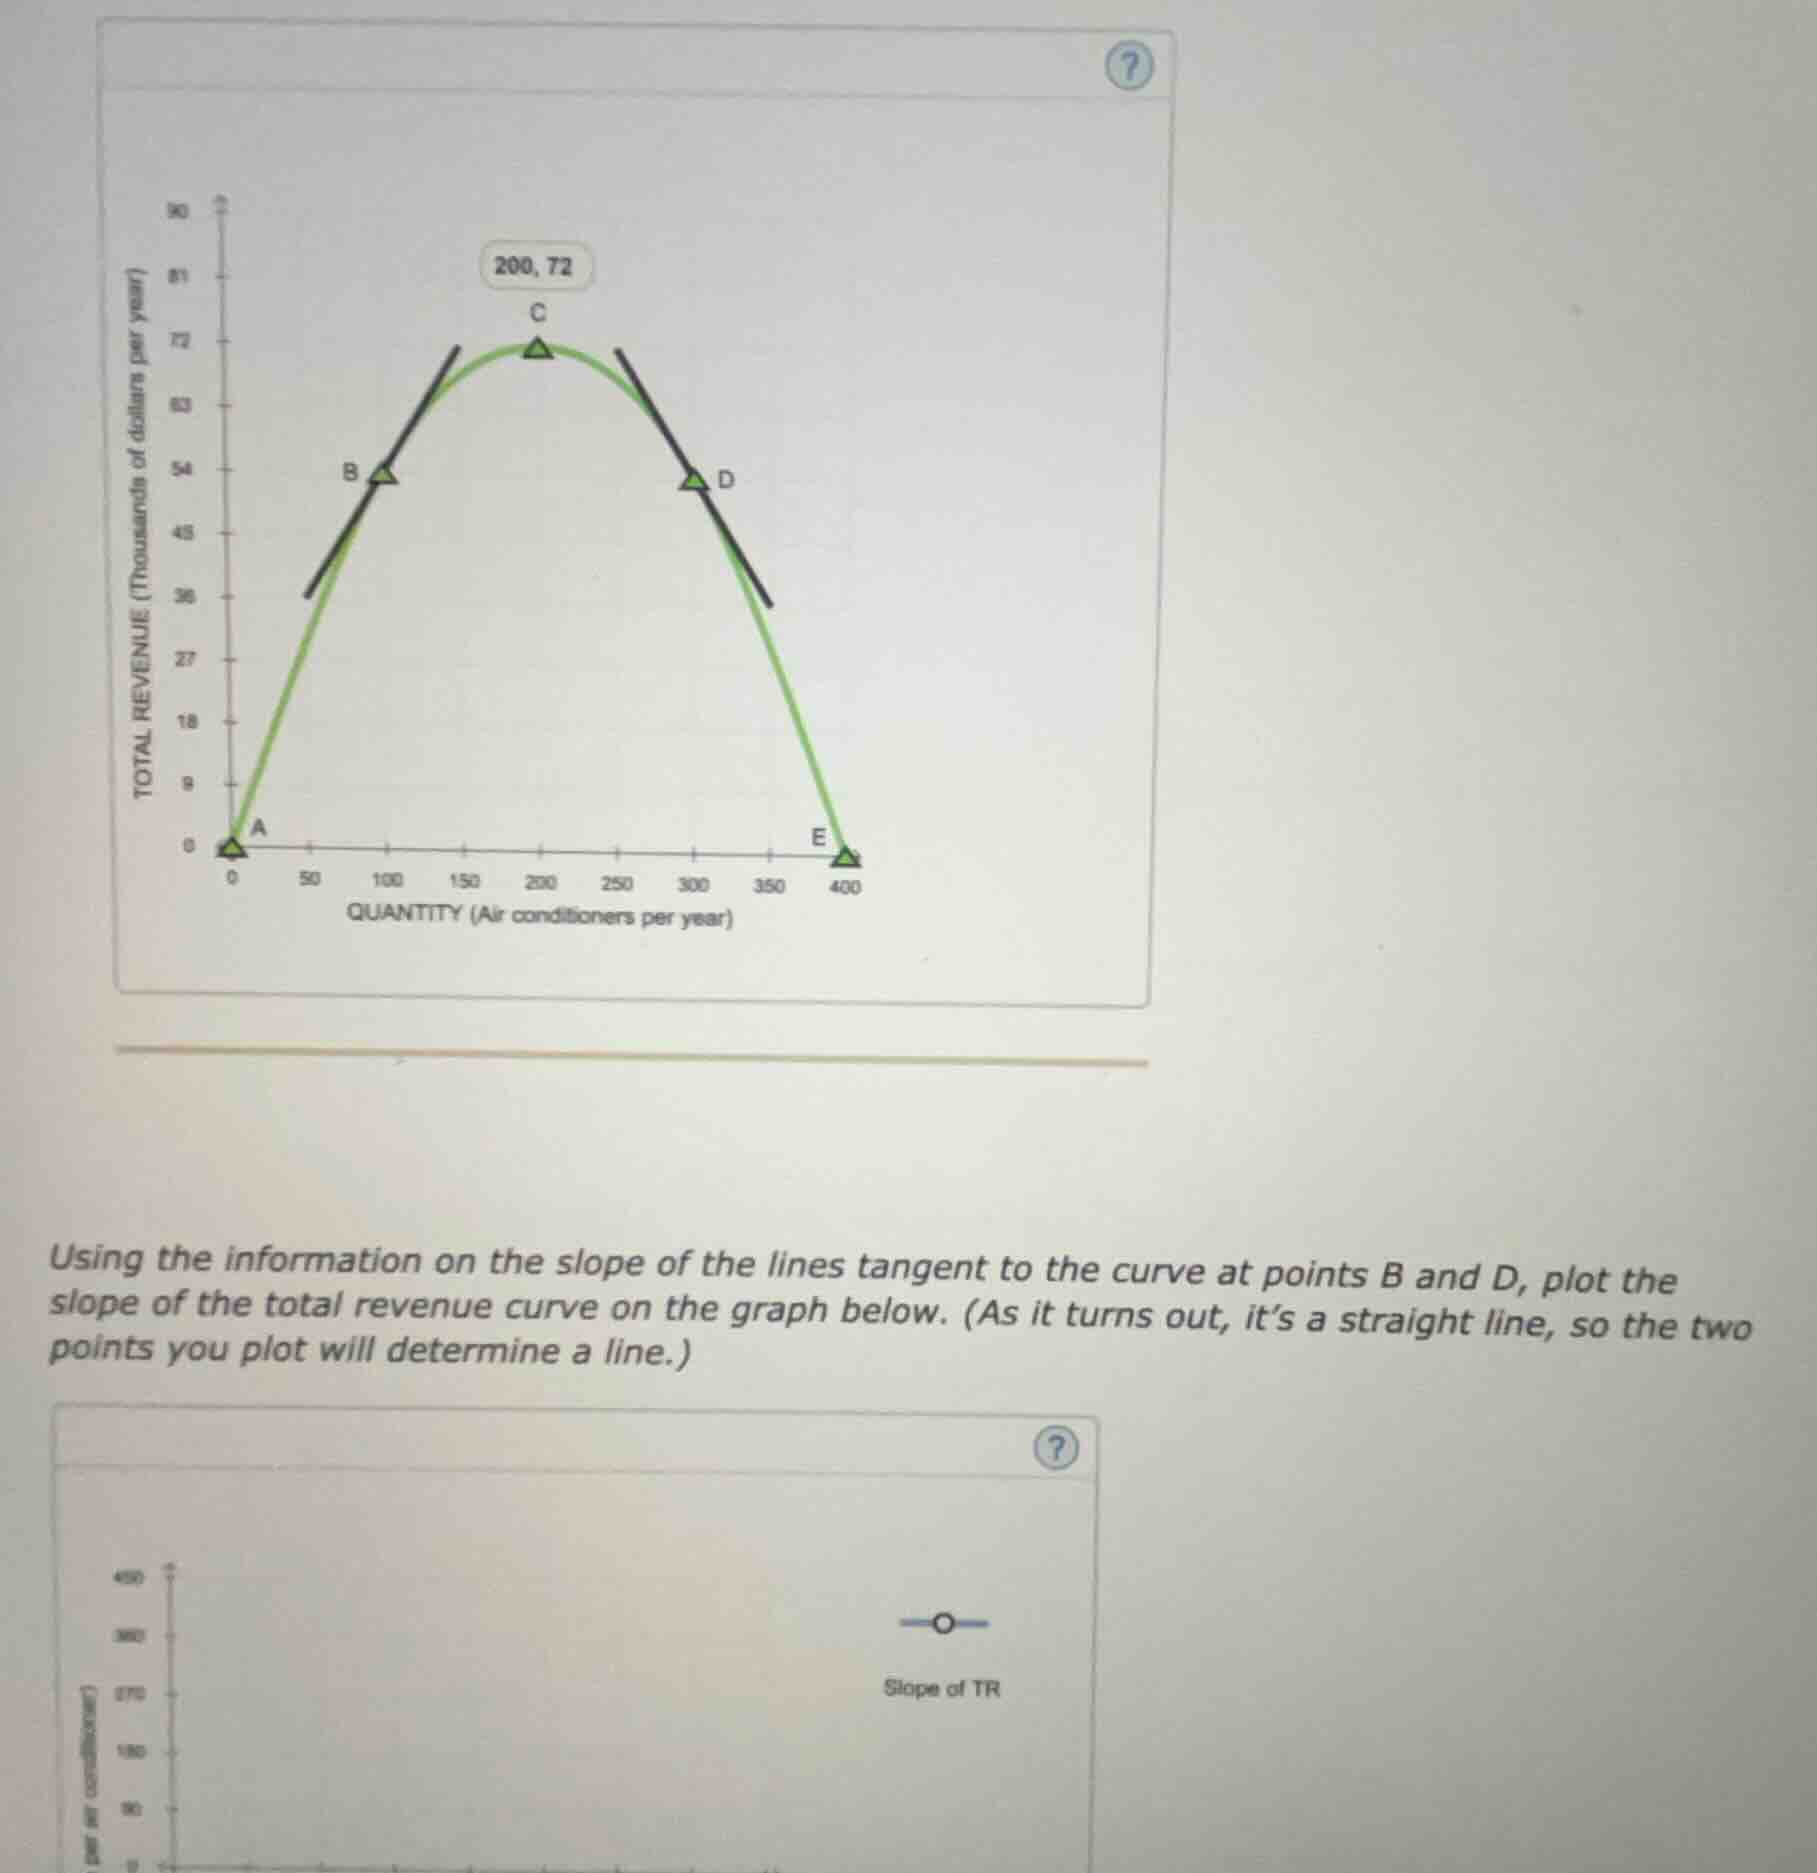
using the information on the slope of the lines tangent to the curve at points b and d, plot the slope of the total revenue curve on the graph below. (as it turns out, it’s a straight line, so the two points you plot will determine a line.)
Step1: Identify point B coordinates
Point B is at quantity = 100, total revenue = 54 (thousand dollars).
Step2: Calculate slope at B
Slope = $\frac{\Delta TR}{\Delta Q}$. Use tangent line: from (0,0) to (200,72) is parallel? No, use tangent for B: connects (0,0) to (200,72)? No, slope at B: $\frac{54 - 0}{100 - 0} = 0.54$? No, better: total revenue function is $TR = aQ - bQ^2$. At C (200,72): $72 = 200a - 40000b$. At E (400,0): $0 = 400a - 160000b$. Solve: from E: $a = 400b$. Substitute to C: $72 = 200*400b - 40000b = 80000b - 40000b = 40000b$, so $b = \frac{72}{40000} = 0.0018$, $a = 400*0.0018 = 0.72$. $TR = 0.72Q - 0.0018Q^2$. Slope (MR) = $\frac{dTR}{dQ} = 0.72 - 0.0036Q$.
At Q=100 (point B): $MR = 0.72 - 0.0036*100 = 0.72 - 0.36 = 0.36$ (in thousands, so 360 dollars per unit).
Step3: Calculate slope at D
Point D is at Q=300. $MR = 0.72 - 0.0036*300 = 0.72 - 1.08 = -0.36$ (in thousands, so -360 dollars per unit).
Step4: Plot the two points
For the slope graph (MR):
- At Q=100, slope = 360
- At Q=300, slope = -360
Connect these two points to form a straight line, which will pass through Q=200, slope=0 (the peak of TR, where MR=0).

Snap & solve any problem in the app
Get step-by-step solutions on Sovi AI
Photo-based solutions with guided steps
Explore more problems and detailed explanations
Plot the points (100, 360) and (300, -360) on the lower graph, then draw a straight line connecting them. This line represents the slope of the total revenue curve (marginal revenue), which intersects the quantity axis at (200, 0).