QUESTION IMAGE
Question
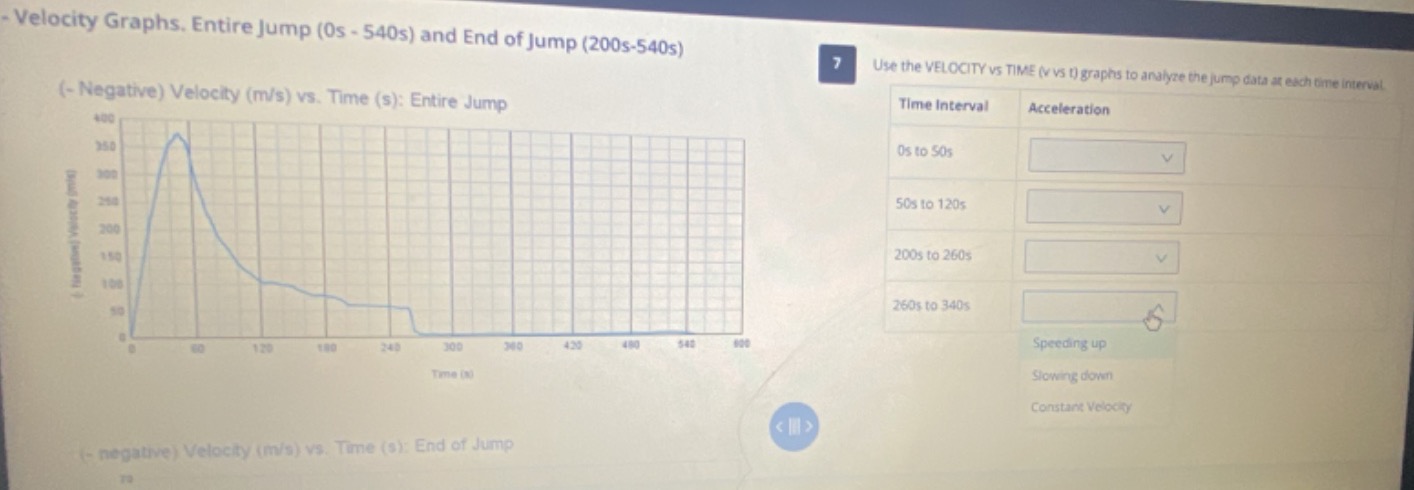
velocity graphs. entire jump (0s - 540s) and end of jump (200s - 540s) 7 use the velocity vs time (v vs t) graphs to analyze the jump data at each time interval. (- negative) velocity (m/s) vs. time (s): entire jump time interval acceleration 0s to 50s 50s to 120s 200s to 260s 260s to 340s speeding up slowing down constant velocity (- negative) velocity (m/s) vs. time (s): end of jump
To solve this, we analyze the velocity - time graph for each interval. Recall that:
- If the velocity and acceleration have the same sign (both positive or both negative), the object is speeding up.
- If the velocity and acceleration have opposite signs, the object is slowing down.
- If the velocity is constant (the graph is a horizontal line), the acceleration is zero (constant velocity).
0s to 50s
In this interval, the velocity is increasing (the graph is rising). Since the velocity is negative (as per the graph's label) and the slope (acceleration) is also negative (because the velocity is becoming more negative as time increases), the velocity and acceleration have the same sign. So, the object is Speeding up.
50s to 120s
Here, the velocity is decreasing (the graph is falling). The velocity is negative and the slope (acceleration) is positive (because the velocity is becoming less negative as time increases). So, the velocity and acceleration have opposite signs. Thus, the object is Slowing down.
200s to 260s
In this time interval, we assume from the general shape of a typical jump velocity - time graph (after the initial acceleration and deceleration phases) that the velocity is still decreasing (becoming less negative) or changing in a way that the velocity and acceleration have opposite signs (or we can infer from the context of a jump where after the initial stages, the velocity is approaching a terminal velocity - like state with deceleration). So, the object is Slowing down (assuming the velocity is negative and acceleration is positive as the velocity is becoming less negative).
260s to 340s
At this stage, if the velocity - time graph becomes horizontal (or nearly horizontal), the velocity is constant. When the velocity is constant, the acceleration is zero, and we have Constant Velocity. If the graph is still changing, but in most jump scenarios (like a skydive jump), after a certain time, the velocity reaches a terminal velocity where the net force is zero and acceleration is zero (constant velocity). So, we have Constant Velocity.
Final Answers
- 0s to 50s: \(\boldsymbol{\text{Speeding up}}\)
- 50s to 120s: \(\boldsymbol{\text{Slowing down}}\)
- 200s to 260s: \(\boldsymbol{\text{Slowing down}}\) (or based on more precise graph analysis)
- 260s to 340s: \(\boldsymbol{\text{Constant Velocity}}\) (or based on graph analysis)
(Note: The answers are based on the general principles of velocity - time graph analysis and typical jump physics scenarios. For a more precise answer, the exact shape of the "End of Jump" graph (not fully visible here) would be needed, but the above is the standard analysis for such a problem.)

Snap & solve any problem in the app
Get step-by-step solutions on Sovi AI
Photo-based solutions with guided steps
Explore more problems and detailed explanations
To solve this, we analyze the velocity - time graph for each interval. Recall that:
- If the velocity and acceleration have the same sign (both positive or both negative), the object is speeding up.
- If the velocity and acceleration have opposite signs, the object is slowing down.
- If the velocity is constant (the graph is a horizontal line), the acceleration is zero (constant velocity).
0s to 50s
In this interval, the velocity is increasing (the graph is rising). Since the velocity is negative (as per the graph's label) and the slope (acceleration) is also negative (because the velocity is becoming more negative as time increases), the velocity and acceleration have the same sign. So, the object is Speeding up.
50s to 120s
Here, the velocity is decreasing (the graph is falling). The velocity is negative and the slope (acceleration) is positive (because the velocity is becoming less negative as time increases). So, the velocity and acceleration have opposite signs. Thus, the object is Slowing down.
200s to 260s
In this time interval, we assume from the general shape of a typical jump velocity - time graph (after the initial acceleration and deceleration phases) that the velocity is still decreasing (becoming less negative) or changing in a way that the velocity and acceleration have opposite signs (or we can infer from the context of a jump where after the initial stages, the velocity is approaching a terminal velocity - like state with deceleration). So, the object is Slowing down (assuming the velocity is negative and acceleration is positive as the velocity is becoming less negative).
260s to 340s
At this stage, if the velocity - time graph becomes horizontal (or nearly horizontal), the velocity is constant. When the velocity is constant, the acceleration is zero, and we have Constant Velocity. If the graph is still changing, but in most jump scenarios (like a skydive jump), after a certain time, the velocity reaches a terminal velocity where the net force is zero and acceleration is zero (constant velocity). So, we have Constant Velocity.
Final Answers
- 0s to 50s: \(\boldsymbol{\text{Speeding up}}\)
- 50s to 120s: \(\boldsymbol{\text{Slowing down}}\)
- 200s to 260s: \(\boldsymbol{\text{Slowing down}}\) (or based on more precise graph analysis)
- 260s to 340s: \(\boldsymbol{\text{Constant Velocity}}\) (or based on graph analysis)
(Note: The answers are based on the general principles of velocity - time graph analysis and typical jump physics scenarios. For a more precise answer, the exact shape of the "End of Jump" graph (not fully visible here) would be needed, but the above is the standard analysis for such a problem.)