QUESTION IMAGE
Question
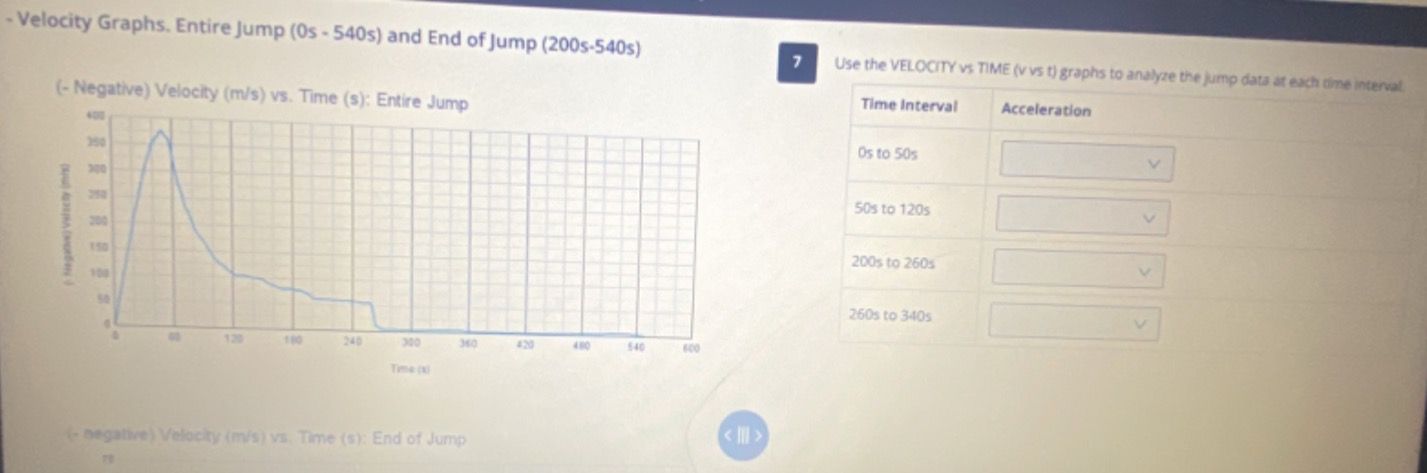
- velocity graphs. entire jump (0s - 540s) and end of jump (200s-540s)
(- negative) velocity (m/s) vs. time (s): entire jump
7 use the velocity vs time (v vs t) graphs to analyze the jump data at each time interval.
| time interval | acceleration |
|---|---|
| 50s to 120s | |
| 200s to 260s | |
| 260s to 340s |
(- negative) velocity (m/s) vs. time (s): end of jump
To determine acceleration from a velocity - time (v - t) graph, we use the formula for acceleration \(a=\frac{\Delta v}{\Delta t}\), where \(\Delta v = v_{final}-v_{initial}\) and \(\Delta t=t_{final}-t_{initial}\). The slope of the velocity - time graph gives the acceleration. If the slope is positive, acceleration is positive; if the slope is negative, acceleration is negative; and if the slope is zero (a horizontal line), acceleration is zero.
1. For the time interval \(0\mathrm{s}\) to \(50\mathrm{s}\)
- Step 1: Analyze the slope of the v - t graph
In the velocity - time graph for the entire jump, from \(t = 0\mathrm{s}\) to \(t = 50\mathrm{s}\), the velocity of the object is increasing with time. The graph has a positive slope in this interval.
- Step 2: Determine the acceleration
Since the slope of the \(v - t\) graph is positive, the acceleration \(a=\frac{\Delta v}{\Delta t}\) is positive. So, the acceleration in the interval \(0\mathrm{s}\) to \(50\mathrm{s}\) is positive (or we can say it has a positive value depending on the units and the exact calculation of the slope).
2. For the time interval \(50\mathrm{s}\) to \(120\mathrm{s}\)
- Step 1: Analyze the slope of the v - t graph
From \(t = 50\mathrm{s}\) to \(t = 120\mathrm{s}\), the velocity of the object is decreasing with time. The graph has a negative slope in this interval.
- Step 2: Determine the acceleration
Using the formula \(a=\frac{\Delta v}{\Delta t}\), since \(\Delta v=v_{120}-v_{50}\) and \(v_{120} In the velocity - time graph, from \(t = 200\mathrm{s}\) to \(t = 260\mathrm{s}\), the velocity of the object is either decreasing at a constant rate (or we can observe the slope of the graph). If we assume the graph has a negative slope (since velocity is still decreasing, although maybe at a different rate than the previous interval), Using \(a = \frac{\Delta v}{\Delta t}\), \(\Delta v=v_{260}-v_{200}\) (negative as velocity is decreasing) and \(\Delta t = 260 - 200 = 60\mathrm{s}\) (positive). So, the acceleration is negative. From \(t = 260\mathrm{s}\) to \(t = 340\mathrm{s}\), if the velocity - time graph is a horizontal line (or has a slope of zero), it means that the velocity of the object is constant. Using the formula \(a=\frac{\Delta v}{\Delta t}\), since \(\Delta v=v_{340}-v_{260} = 0\) (velocity is constant), then \(a=\frac{0}{\Delta t}=0\). So, the acceleration in this interval is zero. (Note: If we had the exact values of velocity at the start and end of each interval, we could calculate the numerical value of acceleration. For example, if at \(t = 0\mathrm{s}\), \(v = 0\mathrm{m/s}\) and at \(t = 50\mathrm{s}\), \(v = 350\mathrm{m/s}\) (from the graph), then \(\Delta v=350 - 0=350\mathrm{m/s}\) and \(\Delta t = 50 - 0 = 50\mathrm{s}\), and \(a=\frac{350}{50}=7\mathrm{m/s}^2\). But since we are analyzing the general trend from the graph, we can conclude about the sign or the fact that it is zero for the last interval based on the slope.) If we assume the following (based on typical skydive or jump scen…3. For the time interval \(200\mathrm{s}\) to \(260\mathrm{s}\)
4. For the time interval \(260\mathrm{s}\) to \(340\mathrm{s}\)

Snap & solve any problem in the app
Get step-by-step solutions on Sovi AI
Photo-based solutions with guided steps
Explore more problems and detailed explanations
To determine acceleration from a velocity - time (v - t) graph, we use the formula for acceleration \(a=\frac{\Delta v}{\Delta t}\), where \(\Delta v = v_{final}-v_{initial}\) and \(\Delta t=t_{final}-t_{initial}\). The slope of the velocity - time graph gives the acceleration. If the slope is positive, acceleration is positive; if the slope is negative, acceleration is negative; and if the slope is zero (a horizontal line), acceleration is zero.
1. For the time interval \(0\mathrm{s}\) to \(50\mathrm{s}\)
- Step 1: Analyze the slope of the v - t graph
In the velocity - time graph for the entire jump, from \(t = 0\mathrm{s}\) to \(t = 50\mathrm{s}\), the velocity of the object is increasing with time. The graph has a positive slope in this interval.
- Step 2: Determine the acceleration
Since the slope of the \(v - t\) graph is positive, the acceleration \(a=\frac{\Delta v}{\Delta t}\) is positive. So, the acceleration in the interval \(0\mathrm{s}\) to \(50\mathrm{s}\) is positive (or we can say it has a positive value depending on the units and the exact calculation of the slope).
2. For the time interval \(50\mathrm{s}\) to \(120\mathrm{s}\)
- Step 1: Analyze the slope of the v - t graph
From \(t = 50\mathrm{s}\) to \(t = 120\mathrm{s}\), the velocity of the object is decreasing with time. The graph has a negative slope in this interval.
- Step 2: Determine the acceleration
Using the formula \(a=\frac{\Delta v}{\Delta t}\), since \(\Delta v=v_{120}-v_{50}\) and \(v_{120} In the velocity - time graph, from \(t = 200\mathrm{s}\) to \(t = 260\mathrm{s}\), the velocity of the object is either decreasing at a constant rate (or we can observe the slope of the graph). If we assume the graph has a negative slope (since velocity is still decreasing, although maybe at a different rate than the previous interval), Using \(a = \frac{\Delta v}{\Delta t}\), \(\Delta v=v_{260}-v_{200}\) (negative as velocity is decreasing) and \(\Delta t = 260 - 200 = 60\mathrm{s}\) (positive). So, the acceleration is negative. From \(t = 260\mathrm{s}\) to \(t = 340\mathrm{s}\), if the velocity - time graph is a horizontal line (or has a slope of zero), it means that the velocity of the object is constant. Using the formula \(a=\frac{\Delta v}{\Delta t}\), since \(\Delta v=v_{340}-v_{260} = 0\) (velocity is constant), then \(a=\frac{0}{\Delta t}=0\). So, the acceleration in this interval is zero. (Note: If we had the exact values of velocity at the start and end of each interval, we could calculate the numerical value of acceleration. For example, if at \(t = 0\mathrm{s}\), \(v = 0\mathrm{m/s}\) and at \(t = 50\mathrm{s}\), \(v = 350\mathrm{m/s}\) (from the graph), then \(\Delta v=350 - 0=350\mathrm{m/s}\) and \(\Delta t = 50 - 0 = 50\mathrm{s}\), and \(a=\frac{350}{50}=7\mathrm{m/s}^2\). But since we are analyzing the general trend from the graph, we can conclude about the sign or the fact that it is zero for the last interval based on the slope.) If we assume the following (based on typical skydive or jump scenarios and the graph shape): If we have to put it in the boxes:3. For the time interval \(200\mathrm{s}\) to \(260\mathrm{s}\)
4. For the time interval \(260\mathrm{s}\) to \(340\mathrm{s}\)
Final Answers (depending on the options in the dropdown, but based on the analysis):