QUESTION IMAGE
Question
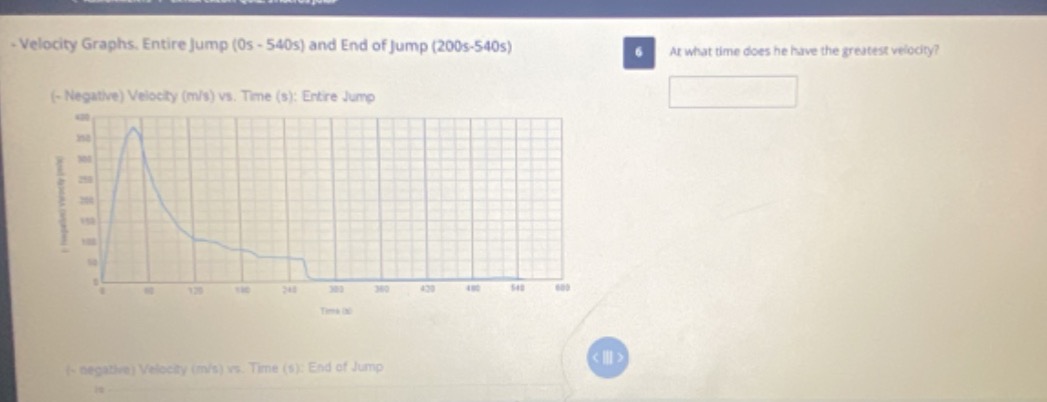
- velocity graphs. entire jump (0s - 540s) and end of jump (200s-540s)
6 at what time does he have the greatest velocity?
(- negative) velocity (m/s) vs. time (s): entire jump
(- negative) velocity (m/s) vs. time (s): end of jump
Step1: Analyze the velocity - time graph
The graph shows the velocity (in m/s) of a jump as a function of time (in s). To find the time when the velocity is the greatest, we look for the peak (the highest point) on the velocity - time curve.
Step2: Identify the time of the peak
From the graph, we can see that the peak of the velocity - time curve occurs at \(t = 60\) seconds (by visually inspecting the graph, the highest point on the curve is at \(t = 60\) s).

Snap & solve any problem in the app
Get step-by-step solutions on Sovi AI
Photo-based solutions with guided steps
Explore more problems and detailed explanations
\(60\) seconds