QUESTION IMAGE
Question
vo-variable linear equations - part 1
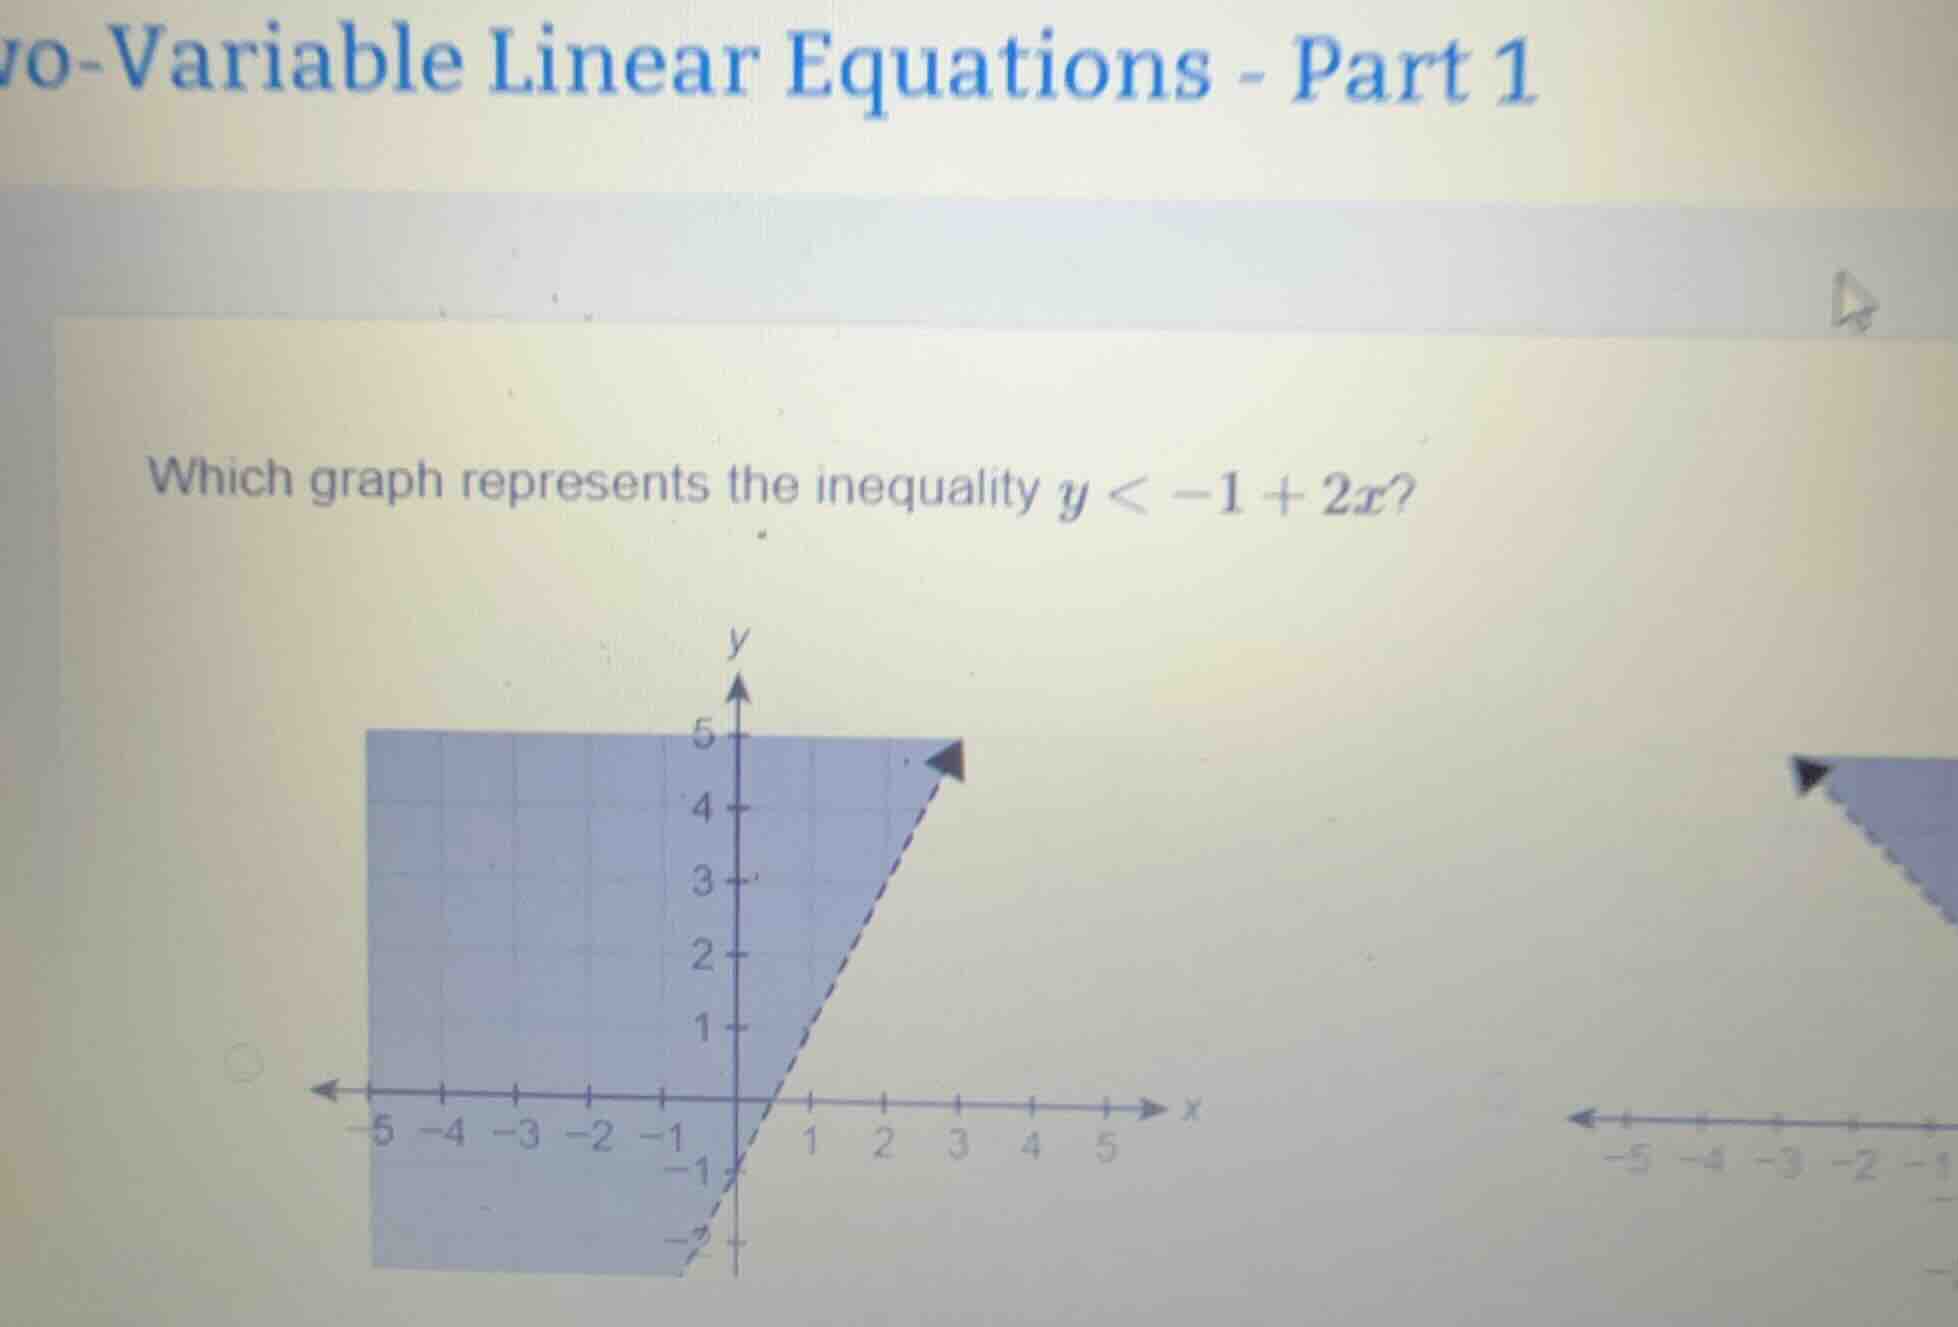
which graph represents the inequality $y < -1 + 2x$?
Step1: Identify boundary line
Rewrite inequality as $y=2x-1$. Since the inequality is $<$ (not $\leq$), the line is dashed.
Step2: Determine shading direction
Test a point not on the line, e.g., $(0,0)$:
$0 < -1 + 2(0) \implies 0 < -1$, which is false. So shade the region not containing $(0,0)$, i.e., below the dashed line.

Snap & solve any problem in the app
Get step-by-step solutions on Sovi AI
Photo-based solutions with guided steps
Explore more problems and detailed explanations
The graph with a dashed line for $y=2x-1$ and shading below the line (not shown fully in the provided image, but the correct graph will have these two features)