QUESTION IMAGE
Question
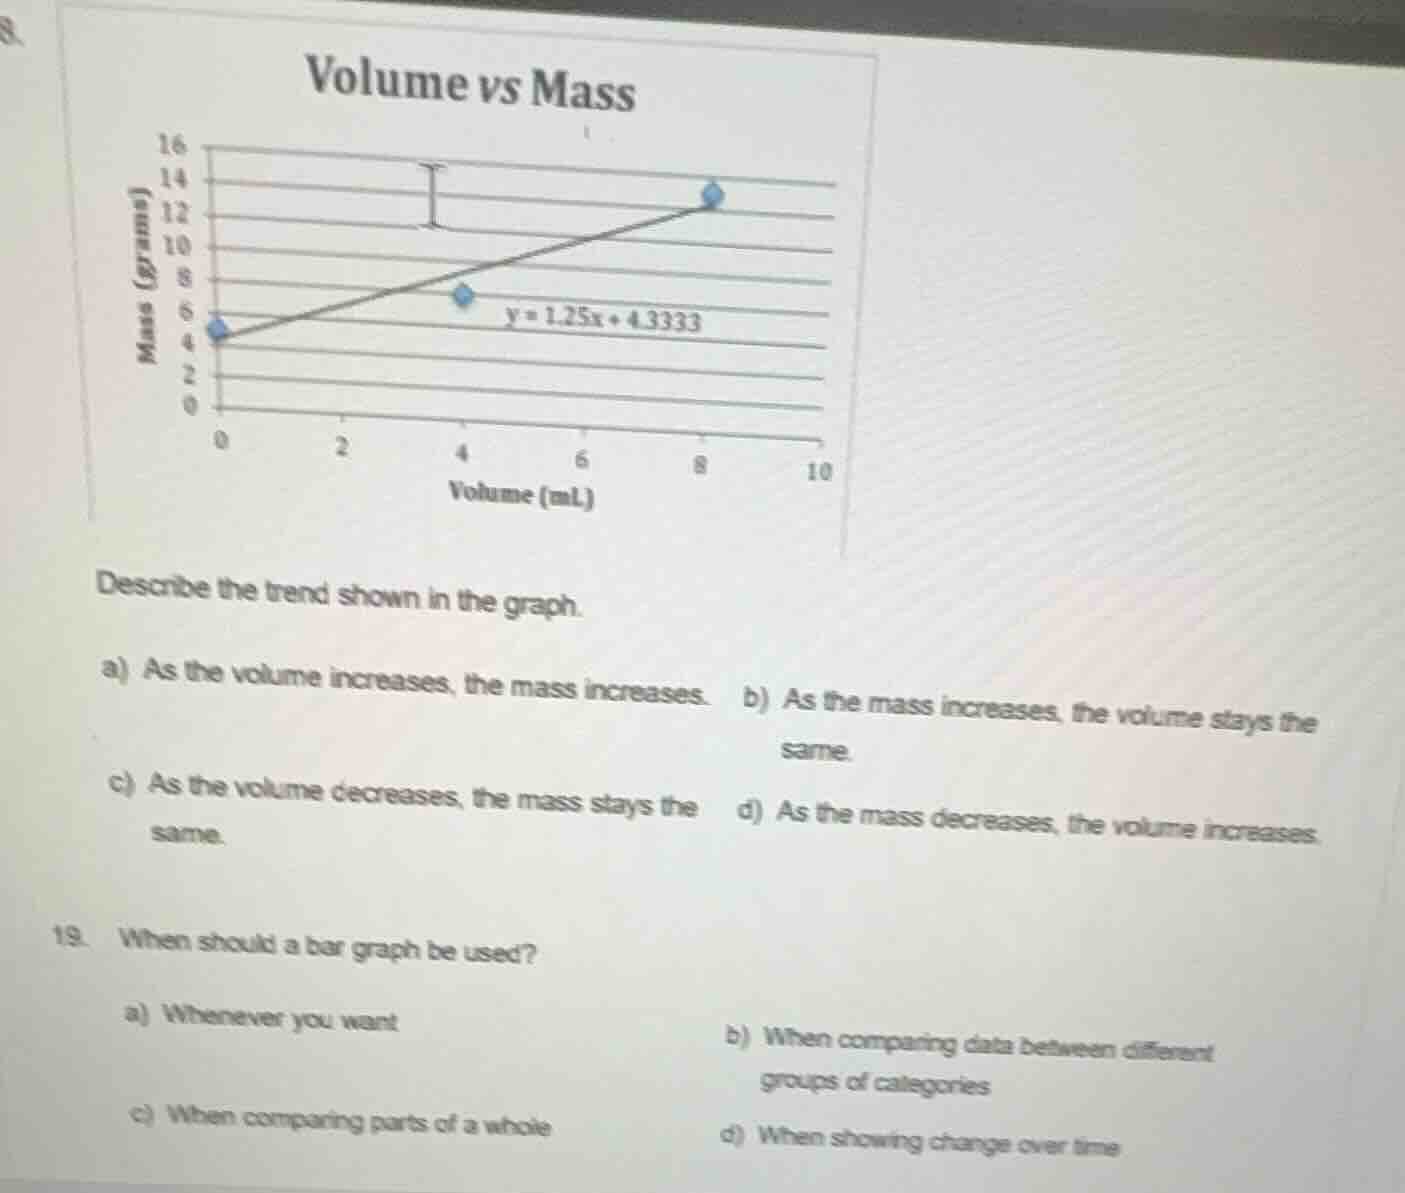
volume vs mass
$y = 1.25x + 4.3333$
describe the trend shown in the graph.
a) as the volume increases, the mass increases. b) as the mass increases, the volume stays the same.
c) as the volume decreases, the mass stays the same. d) as the mass decreases, the volume increases.
- when should a bar graph be used?
a) whenever you want b) when comparing data between different groups of categories
c) when comparing parts of a whole d) when showing change over time
For Question 18:
The graph has a positive-slope linear equation ($y=1.25x+4.3333$), where volume (x-axis) and mass (y-axis) both rise together. Observing the data points: as volume goes from 0 mL to 4 mL to 8 mL, mass increases from ~5g to ~7g to ~13g.
Bar graphs are designed to visually compare discrete, separate groups or categories. Pie charts show parts of a whole, line graphs show change over time, and bar graphs are not for arbitrary use.

Snap & solve any problem in the app
Get step-by-step solutions on Sovi AI
Photo-based solutions with guided steps
Explore more problems and detailed explanations
a) As the volume increases, the mass increases.
---